TIME-DEPENDENT SUPPLEMENTATION OF VITAMIN E INFLUENCES LEPTIN EXPRESSION IN THE AORTIC LAYERS OF RATS FED ATHEROGENIC DIET
INTRODUCTION
One of the main factors influencing pathological changes in blood vessels is nutrition. A high-fat diet rich in saturated fatty acids and cholesterol is known to cause not only obesity but also atherosclerosis and coronary insufficiency (1). Leptin, which is dependent on nutritional status of organism, is stated to be a link between obesity and cardiovascular disease (CVD) (2). This 167-amino acid protein is produced mainly by white adipose tissue. The most potent form of leptin receptor (OB-Rb) was identified not only in the endothelial (3) and vascular smooth muscle cells (4) but also in atherosclerotic lesions (5). Leptin plays an important role in modulation of endothelium function via regulation of nitric oxide (NO) production and endothelium-derived hyperpolarizing factor mechanisms (6). On the other hand, it can also exhibit strong atherogenic properties. Under pathological conditions leptin causes NO/ONOO– (peroxynitrite) imbalance characteristic for endothelium dysfunctions (7). It has been shown that leptin promotes a vascular smooth muscles cells migration and proliferation participating in the formation of a atherosclerotic plaque (8-9).
In the vessels changes of leptin content and actions caused by nutrients have been examined mostly in the context of either dietary fat level or the composition of fatty acids. In our previous studies we stated that leptin expression in the aortic wall was the most common in the endothelium but dietary fat source such as grape seed oil rich in n-6 polyunsaturated fatty acids (PUFA) or the amount of the cholesterol in the diet could enhance its presence in the tunica media and adventitia. The observed changes were connected with atherogenic impact of grape seed oil on lipid profile when the consumption of a high-fat diet was excessive (10). Also in plasma leptin content can be modulated by dietary fat content and as it was shown by Krawczynska et al. (11) the presence of grape seed oil or lard in the diet increased plasma leptin content and modulated lipid profile towards more atherogenic one when high-sucrose diet was consumed. Also Sakr (12) observed an increased serum leptin level but decreased adiponectin one in overweight rats on a high cholesterol and fructose diet. However, despite number of studies examining macronutrients impact on leptin and its possible atherogenic properties, the interaction between leptin and nutrients with antioxidative properties, such as vitamin E, in the aorta is still poorly understood. Consumption of vitamin E positively affects the function of the cardiovascular system. It is well documented that vitamin E inhibits platelet aggregation (13) and secretion of vasoconstrictors and proinflammatory cytokines (interleukine-1b) (14-15). On the other hand these processes can be promoted by leptin (16). These contradictory actions of leptin and vitamin E suggest that interactions between these two factors in the aortic layers are worth to be examined.
Based on these findings, our study was designed to evaluate changes in leptin expression in aortic wall layers (endothelium, tunica media and adventitia) with respect to supplementation with vitamin E and period of feeding with atherogenic diet.
METHODS AND MATERIALS
Animals, diets and experimental design
The study was approved by the Third Local Animal Care and Use Committee in Warsaw (Poland).
The experiment was conducted on 24 male adult Wistar rats (supplied by The Kielanowski Institute of Animal Physiology and Nutrition in Jablonna, Poland) with an initial body weight of 292.8 ± 8.7 g. Animals were kept individually in polypropylene cages under stable conditions (temperature 22°C; humidity 50%; 12:12 light:dark cycle). They were given free access to food and water.
During first week of adaptation, animals were fed a standard rodents’ feed Labofeed H (Andrzej Morawski Feed Production Plant, Kcynia, Poland). Subsequently, in each time-group (3- and 6-week group), animals were divided into two groups (6 animals in each group) fed high-fat (20% w/w), semi-synthetic diets with lard as a dietary fat source, with or without vitamin E (50 mg/100 g of diet) (Table 1). Vitamin E was added as all racemic α-tocopheryl acetate (Medana Pharma S.A., Poland). The fatty acids profile of used lard was determined with AOCS Ce 2-66 method by Industrial Chemistry Research Institute in Warsaw. The main fatty acids were: palmitic acid (C16:0), stearic acid (C18:0), oleic acid (C18:1), linoleic acid (C18:2) and α-linolenic acid (C18:3) - 24.33 g, 14.37 g, 45.63 g, 8.43 g and 0.64 g per 100 g of product, respectively.
2Vitamin mix composition (in 100 g of mix): nicotinic acid - 400 mg, calcium pantothenate - 400 mg, pyridoxine-HCl - 50 mg, thiamin-HCl - 50 mg, riboflavin - 80 mg, folic acid - 20 mg, biotin - 4 mg, vitamin B12 - 0.3 mg, vitamin E - 1000 mg, vitamin A - 200000 IU, vitamin D3 - 20000 IU, vitamin K - 50 mg, PABA - 1 g, inositol - 1 g.
3Vitamin E naturally appearing in lard and used in vitamin mixture was not counted into added 50 mg/100 g of diet. According to Kunachowicz et al., 2005 (17), content of vitamin E in lard is 1.2 mg/100g of product and this amount was taken into consideration when calculation of total vitamin E intake was made as well as vitamin E content in vitamin mixture.
The groups of animals were fed experimental diets for 3 and 6 weeks. Each rat’s body weight was monitored once each week. The food intake was counted by each day measurement of unconsumed diet through the whole experiment. Body weight gain was counted as: (final body weight - initial body weight)/number of days (21 or 42, respectively to the period of feeding).
After the proper feeding period rats were anesthetized via the peritoneum thiopental administration and bled by cardiac puncture. Blood collected to tubes with heparin was centrifuged (20 minutes, 3000 rpm, 4°C) and the obtained plasma was stored at –20°C until further analysis. The aorta was removed and fixed in buffered 10 % formalin for 24 hours.
Plasma lipid profile colorimetric assays
Concentrations of plasma total cholesterol (TC), triacylglycerols (TAG) and high-density lipoprotein cholesterol (HDL) were measured using enzymatic-colorimetric methods. Kits containing ready to use liquid reagents were purchased from PTH Hydrex (Warsaw, Poland). The analyses were held according to kits manuals (TC - cat. no. HXB104; HDL - cat. no. HXB106; TAG - cat. no. SL17628).
Leptin radioimmunological assay
Plasma leptin concentration was measured using rat leptin RIA kit (cat. no. RL-83K, LINCO Research, USA). The intra- and inter-assay precision was 2.4% and 4.8%, respectively. The sensitivity of the test was 0.5 ng/ml. The assay was conducted according to the kit manual.
Leptin immunohistochemical assay in aortic layers
Aorta specimens were analyzed immunohistochemically using the rabbit polyclonal antibody Anti-OB (AB-20) from Santa Cruz Biotechnology Inc. (cat. no. sc-842). Three-micrometer sections of formalin-fixed, paraffin-embedded aorta specimens were deparaffinized with xylene in two changes of 10 minutes each, and rehydrated using graded alcohols (99.8%, 96% and 70%) twice for 5 minutes each. Antigens were retrieved by heating the sections in 0.01 M citrate buffer (pH 6.0) for 20 minutes at 700 W in a microwave oven. Afterwards, specimens were cooled, rinsed with distilled water, kept in phosphate buffered saline (PBS, pH 7.4) for 5 minutes and then incubated for 15 minutes in 10% bovine serum albumin to block non specific tissue reactivity.
The sections were then incubated with the primary antibody Anti-OB (AB-20) in a 1:1000 dilution overnight at 4°C. After incubation with the primary antibody, the slides were incubated with biotinylated secondary goat anti-rabbit IgG (1:1500, /cat. no. 830/, Immunotech, Marseille) for 30 minutes. Endogenous peroxidase activity was inactivated by 5-minute incubation with 3% H2O2, and the sections were then incubated with a peroxidase-conjugated streptavidin (1:500, /cat. no. 309/, Immunotech, Marseille) for 45 minutes. The complex was detected with 3.3’-diaminobenzidine (Sigma-Aldrich, USA) as a chromogen, whereby the sections were lightly counterstained with hematoxylin and mounted in DPX mounting medium (BDH, International, England).
Normal rabbit IgG of the same concentration as the primary antibody was used as a negative control.
Leptin localization was identified in one 3-micrometer section per animal, separately in endothelium (E), tunica media (M) and adventitia (A).
Results were calculated according to Ball et al. (18). One hundred cells per each layer of aorta were assigned to an intensity category of 0 (absent), 1 (weak), 2 (moderate), or 3 (strong) (intensity of each reaction is presented on Fig. 1). The percentage of cells in each intensity category was determined as N0, N1, N2, and N3, respectively. A weighted average (ID score) was then calculated as:
ID = [(N0*0) + (N1*1) + (N2*2)+(N3*3)]/100
The ID score therefore ranged from 0 (absent staining in all cells) to a maximum of 3 (100% cells having a staining intensity of 3).
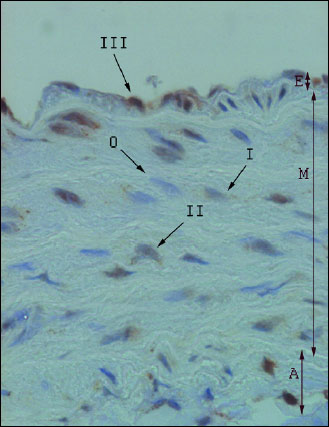 |
Fig. 1. Leptin expression in the aortic wall layers (microscope photo, ×400). E - endothelium; M - tunica media; A - adventitia; 0–III - intensity of immunohistochemical reactions. |
Statistical analysis
Statistical analysis was performed with use of STATISTICA v. 10.00 (StatSoft Polska Sp. z o.o., Cracow, Poland). Results of the simple regression and a two-way analysis of variance (ANOVA) followed by post hoc Fisher’s test were considered statistically significant at p≤0.05. All data are presented as means ± standard deviation.
RESULTS
It was shown that the final body weight gain (after 21 or 42 days) and the daily diet intake were dependent on the period of feeding (ANOVA, p≤0.0001 for both parameters) and their values were higher in the 3-week experiment regardless of the addition of vitamin E (Table 2).
2fbw - final body weight, TC - total cholesterol, HDL - high-density lipoprotein cholesterol, TAG - triacylglycerols; 3L and 6L - groups fed basic diet for 3 and 6 weeks, respectively; 3LE and 6LE - groups fed basic diet with additional vitamin E (50 mg/100 g of diet) for 3 and 6 weeks, respectively; A,B,C,D - indicate values significantly different in rows (ANOVA with Fisher's post-hock test; p≤0.05); n=6 for each group.
ANOVA analysis revealed that all 4 parameters connected with plasma lipid profile (concentration of TC, HDL, TAG and TC/HDL ratio) were influenced by the period of feeding and the vitamin E supplementation. The longer period of feeding increased TC and HDL content (ANOVA, p≤0.0001 for both parameters), however decreased TAG content and TC/HDL ratio (ANOVA, p≤0.0001 for both parameters). Plasma total cholesterol concentration was lower when vitamin E was added but only in the 3-week experiment (Fisher’s test, 3L versus 3 LE: p≤0.02) (Table 2). The vitamin E supplementation caused increase in HDL cholesterol content in plasma after both periods of feeding (Fisher’s test, 3L versus 3LE: p≤0.05 and 6L versus 6LE: p≤0.02). This was linked to lower TC/HDL ratio observed after both periods (Fisher’s test, 3L versus 3LE: p≤0.0001 and 6L versus 6LE: p≤0.05). TAG concentration was higher in plasma of rats fed diet with additional vitamin E in the experiment lasting for 3 weeks (Fisher’s test, 3L versus 3LE: p≤0.0006). No influence of vitamin E on plasma TAG content was observed in the 6-week experiment.
It was shown that the plasma leptin concentration was dependent on the vitamin E supplementation (ANOVA, p≤0.02) and period of feeding (ANOVA, p≤0.0001) with higher values observed in the animals fed atherogenic diet without vitamin E for 3 weeks. The vitamin E addition caused decrease of leptin content in the 3-week group (Fisher’s test, 3L versus 3LE: p≤0.002), however none of such relationship was observed in the 6-week experiment (Fig. 2). Plasma leptin concentration was positively correlated with the body weight gain (p≤0.02, r=0.55) and the daily food intake (p≤0.05, r=0.46) but only in the 3-week experiment.
1 All values are means ± standard deviation; 2 3L and 6L - groups fed basic diet for 3 and 6 weeks, respectively; 3LE and 6LE - groups fed basic diet with additional vitamin E (50 mg/100 g of diet) for 3 and 6 weeks, respectively; A,B,C,D - indicate values significantly different for each aortic layer individually (ANOVA with Fisher’s post-hoc test; pŁ0.05); n=6 for each group.
Leptin expression in all three aortic layers was influenced by the period of feeding with higher values after 6 weeks (ANOVA, p≤0.0001 for all three layers). After 3 weeks the leptin expression in the aortic endothelium, tunica media and adventitia was increased in group fed diet with vitamin E supplementation (Fisher’s test, 3L versus 3LE p≤0.005, p≤0.01 and p≤0.05, respectively for endothelium, tunica media and adventitia) (Fig. 2). The observed increase was the highest in the tunica media (9-fold), while in the endothelium and adventitia the increase was more than 4-fold. The opposite effect was observed in the endothelium after longer period of feeding when the vitamin E addition caused the 27% decrease in leptin expression in endothelium (Fisher’s test, 6L versus 6LE: p≤0.001). No influence of vitamin E on leptin expression was found in tunica media and adventitia after 6 weeks.
 |
Fig. 3. Hypothetical pathways of vitamin E actions on leptin expression in the aorta. (PLA2 - phosholipase A2, AA - arachidonic acid, PGE2 - prostaglandin E2, ONOO– - peroxynitryte, COX-2 - cyclooxygenase 2). |
DISCUSSION
One of the main factors promoting pathological changes in blood vessels is an improperly balanced diet. A high-fat diet rich in saturated fatty acids and cholesterol is known to cause atherosclerosis and coronary insufficiency. On the other hand, consumption of vitamins with antioxidative properties, such as vitamin E, positively affects the function of the cardiovascular system. Leptin, which is influenced by nutritional status of organism, has its receptors in the vessels. Whether a high-fat diet supplemented with vitamin E will change leptin expression in individual layers of the aorta wall (endothelium, tunica media and adventitia) was in our interest. All of the animals were fed high-fat (20% w/w) diets, as such an amount highly exceeds rats’ nutritional needs for fat according to American Institute of Nutrition (19). Lard was used as a dietary fat source as it is a good source of saturated fatty acids and because it is recommended to be eliminated from diet for people with CVD (20). We expected that on such diets animals would have put on weight and became obese. After 3 weeks we observed such a tendency, but after this period the animals which were aimed to be fed for 6 weeks reduced their food intake and started losing weight. However rats which were fed a normal chow diet for 6 weeks gained weight (the average body weight gain was 2.93 ± 0.369 g/d) and consumed more chow (the average daily diet intake 6.255 ± 0.188 g/d/100 g fbw)(the unpublished data). We suggest that a high-fat diet has accelerated the function of a satiety center in the brain, causing the animals to decrease their food intake. This is in contradiction to most studies which showed that high-fat diet rather decreased satiety and promoted hyperphagia (21). Only Gardiner et al. (22) showed that consumption of a high-fat diet reduced food intake which might have been connected with ghrelin balance. In our study the decreased food intake may be also connected with the observed lower values of plasma leptin concentration in the animals fed atherogenic diet for 6 weeks. Also Ainslie et al. (23) observed that short-term (4 weeks) consumption of high-fat diet by rats diets lowered circulating leptin concentration but their rats did not started losing weight. On the other hand Masuzaki et al. (24) observed augmented expression of the obese gene in the adipose tissue from rats fed high-fat diet.
Neither body weight or daily diet intake were affected by vitamin E supplementation. An addition of 50 mg of vitamin E per 100 g of diet increased the vitamin intake sixfold. Such dose of vitamin E was stated to inhibit hepatic nuclear factor-kB activation in rats administered the hepatic tumor promoter (25) and to reduce lipid peroxidation but with no influence on impaired endothelial function in the model of uncontrolled diabetes (26). The results obtained in our experiment showed the downregulating effect of vitamin E on plasma leptin content in 3-week experiment. It is consistent with the results obtained by Shen et al. (27) who observed that vitamin E intervention (35 mg/100 g of diet) decreased leptin content in serum when rats were fed diet inducing obesity (high-fat diet with 38.8% of fat by calories). Also Ben et al. (28) found that vitamin E is involved in the regulation of leptin secretion in obese people. The proposed association may result from the activation of the transcriptional factor - peroxisome proliferator activated receptor gamma (PPARg) by vitamin E. The PPARγ-dependent mechanism has been already shown as the pathway via vitamin E induces expression of other adipokine - adiponectin - in adipocytes (29). Besides, Zeigerer et al. (30) observed that the use of PPARγ agonist increased leptin gene expression while forming intracellular pool of leptin in adipocytes.
In all three aortic layers (endothelium, tunica media and adventitia) we observed an increase of leptin expression followed by elongated period of feeding with the atherogenic diet. As we discussed in our previous studies this may be connected with an intensified leptin production and secretion from perivascular adipose tissue or with an increased sensitivity of endothelium to circulating with blood leptin. We also observed that such an increase depended on the type of dietary fat administrated with diet (flaxseed oil versus grapes seed oil) (10). Not only did the period of feeding influence leptin content in aortic layers. But the obtained results showed that the diet supplemented with vitamin E for 3 weeks increased leptin protein expression in all three aortic layers. It is difficult to judge whether such an increase of leptin expression can exert positive or negative effect on vessels function. Beltowski et al. (31) suggested that in physiological conditions leptin acts as vasodilating mediator and in pathological states it exhibits vasoconstrictory activity. Leptin is stated to increase endothelial NO synthase (eNOS) activity and NO production by Akt/eNOS pathway in endothelial cells causing relaxation of vessels (32). In the pathological conditions (such as obesity) leptin might accelerate atherosclerosis by several mechanisms such as: enhancing pro-inflammatory cytokines production in macrophages and monocytes (interleukin-6, -12, -18, and tumor necrosis factor), increasing oxidative stress in endothelium cells, promoting vascular smooth muscle cell migration and proliferation, increasing obesity-associated hypertension, and stimulating platelet aggregation (15, 33-35). The suppressing effect of vitamin E on TC/HDL ratio after 3-week period of feeding found in our study suggests that vitamin exhibits anti-atherogenic properties despite of increased leptin expression in aortic layers. Moreover, positive correlations between leptin and body weight gain and daily diet intake may indicate a lack of leptin imbalance after shorter period of feeding. The same observation was made in our previous study in which a longer period of feeding with high-fat diet based on grape seed oil or flaxseed oil was required to observe the leptin resistance (10). However, also our present 6-week experiment results showed the positive influence of vitamin E on lipid profile with the opposite effect on leptin content in aortic layers. In endothelium vitamin E supplementation caused a decrease of leptin expression with lack of changes in tunica media and adventitia.
These different effects induced by vitamin E on leptin expression can be explained by its contradictory effects on prostaglandin E2 (PGE2) production which stimulates leptin expression (36). The prostacyclins (for example PGI2 and PGE2) have been now widely examined in case of atherosclerosis as they are said to be an important modulator of vascular functions (37). Wu et al. (38) found that vitamin E in dose-dependent manner increased the production of both PGI2 and PGE2 in the human aortic endothelial cells by stimulation of cytosolic expression of phospholipase A2 (PLA2) and arachidonic acid (AA) release from membrane phosholipids. In the same study vitamin E inhibited cyclooxygenase (COX) activity which should have exerted an opposed effect on PGE2 production. That can suggest that vitamin E acts on PGE2 synthesis in a dose-dependent way. On the other hand, in their earlier experiments Wu et al. (39) observed that vitamin E decreased the age-dependent increase in PGE2 synthesis. However, such effect was stated only in old mice in which vitamin E preferentially inhibited COX activity. Such non-antioxidant effect of vitamin E was also observed in other human tissues and cells. Modulating COX-2 activity in duodenal smooth muscles vitamin E influenced the amplitude and frequency of their contractions (40). Later it was reported that in macrophages vitamin E decreased the COX-2 activity by affecting the production of peroxynitrite (ONOO–) that is a product of NO and superoxide anion radical (41).
These different effects of vitamin E on PGE2 synthesis could be dependent upon oxidative status of organism (Fig. 3). When the organism is young or when the atherogenic diet consumption is not excessive, vitamin E stimulates PLA2 activity and PGE2 production. Then leptin expression is increased and NO synthesis is well balanced. However, when organism is old or when the atherogenic diet is consumed for a longer period, oxidative stress is enhanced directing vitamin E to act as antioxidant and to neutralize overly produced ONOO– inhibiting COX-2 activity. The PGE2 synthesis is decreased leading to alteration in leptin expression. Therefore, vitamin E seems to be an important modulator of leptin expression in aortic walls. Inhibiting ONOO– production vitamin E might not only decrease leptin synthesis but can also adverse its negative impact on NO/ONOO– balance which is one of the leptin-dependent endothelium dysfunction (7).
Summarizing, vitamin E might influence leptin expression in aortic layers in rats fed atherogenic diet. Our results suggest that supplementation of diet with vitamin E may protect against cardiovascular disease via two opposite mechanisms depending on the length of atherogenic diet consumption. This may be connected with vasodilating and vasoconstrictory properties of leptin.
Acknowledgements: This project was supported by grants from the Ministry of Science and Higher Education of Poland (No. 2 P06T 031 27).
Conflict of interests: None declared.
REFERENCES
- Vafeiadou K, Weech M, Sharma V, et al. A review of the evidence for the effects of total dietary fat, saturated, monounsaturated and n-6 polyunsaturated fatty acids on vascular function, endothelial progenitor cells and microparticles. Br J Nutr 2012; 107: 303-324.
- Sweeney G. Cardiovascular effects of leptin. Nat Rev Cardiol 2010; 7: 22-29.
- Fortuno A, Rodriguez A, Gomez-Ambrosi J, et al. Leptin inhibits angiotensin II- induced intracellular calcium increase and vasoconstriction in the rat aorta. Endocrinology 2002; 143: 3555-3560.
- Sierra-Honigmann RM, Nath AN, Murakami C, et al. Biological action of leptin as an angiogenic factor. Science 1998; 281: 1683-1686.
- Schroeter MR, Schneiderman J, Schumann B, et al. Expression of the leptin receptor in different types of vascular lesions. Histochem Cell Biol 2007; 128: 323-333.
- Lembo G, Vecchione C, Fratta L, Marino G, Trimarco V, d’Amati G, Trimarco B. Leptin induces direct vasodilation through distinct endothelial mechanisms. Diabetes 2000; 49: 293-297.
- Korda M, Kubant R, Patton S, Malinski T. Leptin-induced endothelial dysfunction in obesity. Am J Physiol Heart Circ Physiol 2008; 295: H1514-H1521.
- Oda A, Taniguchi T, Yokoyama M. Leptin stimulates rat aortic smooth muscle cell proliferation and migration. Kobe J Med Sci 2001; 47: 141-150.
- Huang F, Xiong X, Wang H, You S, Zeng H. Leptin-induced vascular smooth muscle cell proliferation via regulating cell cycle, activating ERK1/2 and NF-kappaB. Acta Biochim Biophys Sin (Shanghai) 2010; 42: 325-331.
- Krawczynska A, Olczak E, Rembiszewska A, Gromadzka-Ostrowska J. High-fat, cholesterol-rich diet affects leptin expression in the aortic layers. Exp Biol Med (Maywood) 2013; 238: 47-56.
- Krawczynka A, Okrelicka K, Olczak E, Gromadzka-Ostrowska J. Effect of dietary fat type on plasma lipid profile and leptin concentration in rats fed high-sucrose diets. JPCCR 2010; 4: 57-62.
- Sakr HF. Modulation of metabolic and cardiac dysfunctions by swimming in overweight rats on a high cholesterol and fructose duet: possible role of adiponectin. J Physiol Pharmacol 2013; 64: 231-240.
- Saldeen T, Li D, Mehta JL. Differential effects of alpha- and gamma-tocopherol on low-density lipoprotein oxidation, superoxide activity, platelet aggregation and arterial thrombogenesis. J Am Coll Cardiol 1999; 34: 1208-1215.
- Devaraj S, Li D, Jialal I. The effects of alpha tocopherol supplementation on monocyte function. Decreased lipid oxidation, interleukin 1 beta secretion, and monocyte adhesion to endothelium. J Clin Invest 1996; 98: 756-763.
- Wu D, Liu L, Meydani M, Meydani SN. Vitamin E increases production of vasodilator prostanoids in human aortic endothelial cells through opposing effects on cyclooxygenase-2 and phospholipase A2. J Nutr 2005; 135: 1847-1853.
- Beltowski J. Leptin and atherosclerosis. Atherosclerosis 2006; 189: 47-60.
- Kunachowicz H, Nadolna I, Przygoda B, Iwanow K. Tabela skladu i wartosci odzywczej. Warszawa, Wydawnictwo Lekarskie PZWL, 2005, pp. 176-183.
- Ball E, Bond J, Franc B, Demicco C, Wynford-Thomas D. An immunohistochemical study of p16INK4a expression in multistep thyroid tumorigenesis. Eur J Cancer 2007; 43: 194-201.
- Reeves PG. Components of the AIN-93 diets as improvements in the AIN-76A diet. J Nutr 1997; 127 (Suppl. 5): 838S-841S.
- de Lorgeril M, Salen P. New insights into the health effects of dietary saturated and omega-6 and omega-3 polyunsaturated fatty acids. BMC Med 2012; 10: 50.
- Nefti W, Chaumontet C, Fromentin G, Tome D, Darcel N. A high-fat diet attenuates the central response to within-meal satiation signals and modifies the receptor expression of vagal afferents in mice. Am J Physiol Regul Integr Comp Physiol 2009; 296: R1681-R1686.
- Gardiner JV, Campbell D, Patterson M, et al. The hyperphagic effect of ghrelin is inhibited in mice by a diet high in fat. Gastroenterology 2010; 138: 2468-2476.
- Ainslie DA, Proietto J, Fam BC, Thorburn AW. Short-term, high-fat diets lower circulating leptin concentrations in rats Am J Clin Nutr 2000; 71: 438-442.
- Masuzaki H, Ogawa Y, Hosoda K, Kawada T, Fushiki T, Nakao K. Augmented expression of the obese gene in the adipose tissue from rats fed high-fat diet. Biochem Biophys Res Commun 1995; 216: 355-358.
- Calfee-Mason KG, Spear BT, Glauert HP. Vitamin E inhibits hepatic NF-kappaB activation in rats administered the hepatic tumor promoter, phenobarbital. J Nutr 2002; 132: 3178-3185.
- Palmer AM, Thomas CR, Gopaul N, et al. Dietary antioxidant supplementation reduces lipid peroxidation but impairs vascular function in small mesenteric arteries of the streptozotocin-diabetic rat. Diabetologia 1998; 41: 148-156.
- Shen XH, Tang QY, Huang J, Cai W. Vitamin E regulates adipocytokine expression in a rat model of dietary-induced obesity. Exp Biol Med (Maywood) 2010; 235: 47-51.
- Ben Slama F, Boujmil A, Dekhil J, et al. Vitamins A, E and leptin in obese and non-insulin-dependent diabetes. Tunis Med 2009; 87: 726-730.
- Landrier JF, Gouranton E, Yazidi CE, et al. Adiponectin expression in induced by vitamin E via a peroxisome proliferator-activated receptor γ-dependent mechanism. Endocrinology 2009; 150: 5318-5325.
- Zeigerer A, Rodeheffer MS, McGraw TE, Friedman JM. Insulin regulates leptin secretion from 3T3-L1 adipocytes by a PI3 kinase independent mechanism. Exp Cell Res 2008; 314: 2249-2256.
- Beltowski J, Wojcicka G, Jamroz-Wisniewska A, Marciniak A. Resistance to acute NO-mimetic and EDHF-mimetic effects of leptin in the metabolic syndrome. Life Sciences 2009; 85: 557-567.
- Vecchione C, Maffei A, Colella S, et al. Leptin effect on endothelial nitric oxide is mediated through Akt-endothelial nitric oxide synthase phosphorylation pathway. Diabetes 2002; 51: 168-173.
- Dubey L, Hesong Z. Role of leptin in atherogenesis. Exp Clin Cardiol 2006; 11: 269-275.
- Maenhaut N, Van de Voorde J. Regulation of vascular tone by adipocytes. BMC Med 2011; 9: 25.
- Beltowski J. Leptin and the regulation of endothelium function in physiological and pathological conditions. Clin Exp Pharmacol Physiol 2012; 39: 168-178.
- Fain JN, Leffler CW, Cowan GS Jr, Buffington C, Pouncey L, Bahouth SW. Stimulation of leptin release by arachidonic acid and prostaglandin E2 in adipose tissue from obese humans. Metabolism 2001; 50: 921-928.
- Smith DD, Tan X, Tawfik O, Milne G, Stechschulte DJ, Dileepan KN. Increased aortic atherosclerotic plaque development in female apolipoprotein E-null mice is associated with elevated thromboxane A2 and decreased prostacyclin production. J Physiol Pharmacol 2010; 61: 309-316.
- Wu D, Liu L, Meydani M, Meydani S.N. Effect of vitamin E on prostacyclin (PGI2) and prostaglandin (PG) E2 production by human aorta endothelium cells. Ann NY Acad Sci 2004; 1031: 425-427.
- Wu D, Mura C, Beharka AA, et al. Age-associated increase in PGE2 synthesis and COX activity in murine macrophages is reserved by vitamin E. Am J Physiol 1998; 275: C661-C668.
- Fagundes DS, Grasa L, Gonzalo S, et al. Mechanism of action of Trolox on duodental contractility. J Physiol Pharmacol 2013; 64: 705-710.
- Berharka AA, Wu D, Serafini M, Meydani SN. Mechanism of vitamin E inhibition of cyclooxygenase activity in macrophages from old mice: role of peroxynitrite. Free Radic Biol Med 2002; 32: 503-511.
A c c e p t e d : January 21, 2014