CYCLOSPORINE A-INDUCED NEPHROTOXICITY IS AMELIORATED BY DOSE REDUCTION AND CONVERSION TO SIROLIMUS IN THE RAT
INTRODUCTION
Cyclosporine A (CsA), a calcinerin inhibitor (CNI), considerably improves organ and patient survival after allograft transplantation, when compared with the pre-CsA era of immunotherapy. In addition, CsA has also been used to treat several autoimmune disorders, such as psoriasis, rheumatoid arthritis, systemic lupus erythematosus and inflammatory bowel disease, among other, leading to its widespread use over the last 25 years (1, 2). Despite the impressive reduction in the number of acute rejection episodes after the beginning of CsA use in clinical practice, its long-term therapy is typically associated with drug-induced nephrotoxicity (3). The most common causes of late graft losses and patient deaths are combined interstitial fibrosis, tubular atrophy and cardiovascular disease (4). Given the important negative impact of chronic renal failure on the evolution and prognosis after transplant, intensified efforts in recent years have sought to introduce less nephrotoxic protocols based on reduced CNI doses, but with adequate efficacy for prevention of acute rejection episodes (5). Complete avoidance of CNIs, in particular of CsA, has been viewed as an invalid option by almost all the transplantation centres worldwide, particularly because of the high risks in acute rejection. In fact, a high percentage (up to 90%) of kidney transplant recipients is treated with a calcineurin inhibitor-based immunosuppressive regimen, including CsA, as reported by Sanchez-Pozos et al. (6).
The main long-term goals for immunosuppressive therapy are to reduce drug exposure while still maintaining a well-functioning graft, keeping efficacy and minimizing drug-induced serious side-effects, including infections and nephrotoxicity (7). The recognition of CsA adverse effects has sparked interest in the clinical use of alternative CsA-sparing strategies (8), including dose reduction and replacement protocols, which are the current preferred therapies, namely the conversion to other drugs (5), especially sirolimus (SRL), an inhibitor of the mammalian target of rapamycin (mTOR) (9-11). The use of reduced CsA doses immediately after renal transplantation has already been assessed in clinical trials (12-16) and the results suggest a benefit on renal function with a reduction in serum creatinine levels without a significant change in clinical endpoints (biopsy-proven rejection episodes or death). However, these trials were not sufficiently powered to prove clinical outcomes, and many transplantation centers worldwide still prefer to use higher CsA doses as the starting therapy to ensure reliable immunosuppression, followed by dose reduction and conversion protocols, especially in patients at high risk of rejection. On the other hand, in spite of the SRL-evoked side effects, including proteinuria, it has been indicated as a less nephrotoxic immunosuppressive agent when compared to the calcineurin inhibitors (17). However, the putative improvement on renal function and structure after conversion from CsA to SRL still needs to be clarified.
In the last decades, the mechanisms underlying CsA-induced nephropathy have been discussed and at now have been viewed as having a multifactorial cause (including vasorelaxant-vasoconstrictor disequilibrium, oxidative stress, apoptosis and proliferation-fibrosis) (18-22), changing with the increased duration of exposure and dose used (23). However, the CNI-based post-transplantation immunosuppressive therapy protocols have changed in recent years. The major question being debated is to find the most adequate duration for CsA exposure and the proper moment to promote dose reduction and/or replacement to other less nephrotoxic drug, such as SRL, in order to maintain renoprotection without compromising the graft by a rejection episode. The precise molecular mechanisms, and biomarkers, underlying the transition from renal dysfunction (no tissue lesions) to nephrotoxicity (presence of lesions) deserve better elucidation. Drug safety evaluation has mainly been based on biochemical and histopathological evaluation; however, safety liabilities or early predictive biomarkers for drug-induced organ damage are of great value for the early diagnosis of nephropathy, particularly because the initial stages of CsA-induced nephropathy are largely asymptomatic, making early damage diagnosis difficult (24). Further experimental studies would be invaluable to improve the knowledge on this issue of clinical relevance; moreover, emergent diagnostic biomarkers of renal damage, such as neutrophil gelatinase-associated lipocalin NGAL, kidney injury molecule-1 KIM-1, and connective tissue growth factor CTGF, among others, deserve proper attention.
We have previously shown, in preliminary studies using an experimental model comparing clinical doses of CsA and SRL, that distinct pathways and biomarkers appear to be involved in the early effects of these drugs directly on kidney tissue, even before renal lesions are present (25, 26). The current study evaluates the impact on the renal function and lesions of a protocol based on CsA dose reduction and further conversion to SRL in a rat model, focus on serum, urine and renal tissue classical and emergent biomarkers.
MATERIALS AND METHODS
Animals and treatments
Male Wistar rats (11 week-old) were purchased from Charles River Laboratories (Barcelona, Spain) and housed (two animals per cage) in individually ventilated cages (IVCs) racks, subjected to 12/12 h dark/light cycles and given standard laboratory rat chow (IPM-R20, Letica, Barcelona, Spain) and free access to tap water. Animals were divided into 3 treatments (groups) of 9 weeks: control (vehicle - orange juice), CsA (5 mg/kg b.w./day of Sandimun Neoral®, Novartis Farma Produtos Farmaceuticos SA, Sintra, Portugal, devolved in orange juice) and Red + Conv (CsA 30 mg/kg b.w./day during the initial 3 weeks, followed by 3 weeks of CsA dose reduction to 5 mg/kg b.w./day and then conversion in the final 3 weeks to 1 mg/kg bw/day of SRL, Rapamune®, Laboratorios Pfizer Lda., Lisbon, Portugal). The study enrolled 6 rats per time course per group. Treatments were performed by oral gavage and body weight was monitored daily. Animal experiments were conducted according to the European Council Directives on Animal Care and to the National Authorities.
Blood pressure, heart rate, and drugs blood concentrations monitoring
Heart rate, systolic blood pressure (SBP) and diastolic blood pressure (DBP) values were obtained using a tail-cuff sphygmomanometer LE 5001 (Letica, Barcelona, Spain) in appropriate contention cages. Blood pressure (BP) values were obtained by averaging 8–10 measurements, registered by the same person, in a quiet environment, between 14:00 and 18:00. BP measurements were performed with special precautions to minimize stress-induced fluctuations.
CsA and SRL blood concentrations were assessed by immunoassay using automatic methods (Flex reagent) and equipment (Dimension®RxL, Siemens, Germany).
Sample collection and preparation
The rats were anesthetized (i.p.) with 2 mg/kg b.w. of a 2:1 (v:v) 50 mg/mL ketamine (Ketalar®, Parke-Davis, Pfizer Laboratories Lda, Seixal, Portugal) solution in 2.5% chlorpromazine (Largatil®, Rhone-Poulenc Rorer, Vitoria Laboratories, Amadora, Portugal). Blood samples were immediately collected, by venipuncture, from the jugular vein in needles with no anticoagulant for serum samples. Rats were then sacrificed by cervical dislocation, and the kidneys were immediately removed, weighted, divided and frozen in nitrogen for lipid peroxidation assays or pre-fixed in formaldehyde for histopathological and immunohistochemical analysis.
Serum and urinary measurements
Serum creatinine, blood urea nitrogen (BUN), glucose, triglycerides and total cholesterol were evaluated by automatic validated methods and equipments (Hitachi 717 analyser, Roche Diagnostics Inc., MA, USA). Insulin levels were measured using a rat enzyme-linked immunosorbent assay (ELISA) kit from Mercodia (Uppsala, Sweden). Levels of neutrophil gelatinase-associated lipocalin (NGAL) were measured by ultrasensitive Quantikine ELISA kit (BioPorto®, Denmark) in serum (1:10000) and urine (1:20000). For urine analysis, animals were housed in metabolic cages during 24 hours receiving tap water and food ad libitum. The urine concentrations of creatinine, BUN and protein were assessed over 24 hours (Cobas Integra 400 plus, Roche®). Urine volumes were measured in order to calculate creatinine and BUN clearance, as well as glomerular filtration rate, as previously described (27).
Serum, kidney and 24 hour urine lipid peroxidation
Lipid peroxidation was determined by assaying the malondialdheyde (MDA) production using the thiobarbituric acid (TBA) test. Briefly, 100 µl of kidney tissue homogenized, serum or urine (previously centrifuged to remove particulates) were incubated 1 hour in a TBA solution. Samples were incubated at 90°C for 60 min. In this test, one molecule of MDA reacts with two molecules of TBA with the production of a pink pigment producing maximal absorbance at 532 nm. The concentration of MDA was calculated in respect to a calibration curve using 1,1,3,3-tetramethoxypropane as the external standard (range: 0.1–83.5 µM) and results were expressed as µM/g of kidney tissue and µM of serum or urine.
Histopatological analysis
Haematoxylin and eosin staining
Samples were fixed in Bock’s fixative and embedded in paraffin wax, and 4µm thick sections were mounted on glass slides and stained for routine histopathological diagnosis with haematoxylin and eosin (H&E).
Periodic acid of schiff staining
Periodic acid-schiff (PAS) was used to evaluate and quantify renal lesions. Samples were fixed in 10% neutral formalin, embedded in paraffin wax, and 4 µm thick sections were immersed in water and subsequently treated with a 1% aqueous solution of periodic acid, then washed to remove any traces of periodic acid, and finally treated with Schiff’s reagent. All samples were examined by light microscopy using a Zeiss Microscope Mod. Axioplan 2. Degrees of injury visible by light microscopy were scored, in a double-blinded fashion, by two independent pathologists. Lesions were evaluated on the total slide.
Lesion analysis
Glomerular damage was assessed by evaluating mesangial expansion, glomerular basement membrane and the Bowman’s capsule thickening, nodular sclerosis, vascular pole hyalinosis, as well as glomerular atrophy. The analysed tubulointerstitial lesions comprised inflammatory infiltration, presence of hyaline cylinders, tubular basement membrane irregularity, calcification, vacuolization, and expansion, as well as interstitial fibrosis and tubular atrophy (IFTA). The evaluation of vascular lesions was concentrated on vascular congestion and hyperemia, arteriolosclerosis and arteriosclerosis. A semi-quantitative rating for each slide ranging from normal (or minimal) to severe (extensive damage) was assigned to each component. Severity was graded as absent/normal (0), mild (1), moderate (2), and severe (3). Scoring was defined according to the extension of the lesion (number of capsules): normal: 0%; mild: <25%; moderate: 25–50%; severe: >50%. The final score for each sample was obtained by the average score observed in each individual glomeruli in the considered microscopic fields. Tubular calcification was evaluated and graded by the same semiquantitative method. Regarding vascular lesions, arteriosclerosis was scored as 0 if no intimal thickening was present, as 1 if intimal thickening was less than the thickness of the media, and as 2 if intimal thickening was more than the thickness of the media and considering the worst artery on the slide. Using PAS, the rating was set for intensity and extension of staining, ranging from 0 (no staining) to 3 (intense and extensive staining), respecting tissue specificity scoring when adequate.
Masson’s trichrome staining
- Deparaffinise and rehydrate through 100% alcohol, 95% alcohol 70% alcohol.
- Wash in distilled water.
- After that, re-fix in Bouin’s solution for 1 hour at 56°C to improve staining quality and rinse in running tap water for 5–10 minutes to remove the yellow colour.
- Stain in Weigert’s iron hematoxylin working solution for 10 minutes and rinse in running warm tap water for 10 minutes.
- Wash in distilled water.
- Stain in Biebrich scarlet-acid fuchsin solution for 10–15 minutes and wash in distilled water.
- Differentiate in phosphomolybdic-phosphotungstic acid solution for 10–15 minutes and transfer sections directly to aniline blue solution and stain for 5–10 minutes.
- Rinse briefly in distilled water and differentiate in 1% acetic acid solution for 2–5 minutes and wash in distilled water.
- Finally, dehydrate very quickly through 95% ethyl alcohol, absolute ethyl alcohol, clear in xylene and mount with resinous mounting medium.
Samples were examined by expert pathologists that was blinded to what the samples were, using light microscopy on a Zeiss Microscope Axioplan 2.
Immunohistochemical analysis
Immunohistochemical analyses were performed in 4 µm thick sections with sagittal orientation of kidney tissue fixed in Bock’s fixative and embedded in paraffin wax. The samples were processed by indirect immune detection technique with mouse and rabbit specific HRP/DAB detection IHC kit (Abcam, Cambridge, UK). The protocol was executed according the manufacturer’s instructions. In this study, we employed primary antibodies against connective tissue growth factor (CTGF) (dilution 1:100, ab6992; Abcam), transforming growth factor beta (TGF-β) (dilution 1:100, ab66043; Abcam), mammalian target of rapamycin (mTOR) (dilution 1:250, 04-385; Millipore), nuclear factor kappa beta (NF-κβ) (dilution 1:500, sc-114; Santa Cruz Biotechnology), and kidney injury molecule (KIM-1) (dilution 1:14, AF3689; R&D Systems). For KIM-1 detection the secondary antibody was anti-goat (dilution 1:500, sc2771; Santa Cruz Biotechnology). To identify proliferating cell nuclear antigen PCNA protein we used a standard kit (93-1143, Invitrogen Corporation). An appropriate positive control was used for each staining run, and each slide was stained with a negative control obtained by omitting the primary antibody. Standard procedures were used for visualisation and the staining was quantified using a semi quantitative scale (1–4) that evaluated both the intensity and area of staining. Intensity was graded as very low (1), low (2), moderate/mild (3) and high (4); staining area was graded as <25% (1), 25–50% (2), 25–75% (3) and >75% (4). All data slides were evaluated independently by two investigators that were blinded as to the content in the data slides. In this evaluation, a quantitative immunohistochemical score (QIC) was calculated, according to the formula: QIC = staining area grading * staining intensity grading * 0.1.
Statistical analysis
Statistical analyses were performed using the GraphPad Prism(R) for Windows (version 5.00). The results are presented as means ± S.E.M. Comparisons between groups were performed using One-Way ANOVA test, followed the post hoc Bonferroni’s multiple comparisons. The association between categorical variables was analyzed using Pearson’s test in the IBM Statistical Package for Social Sciences (SPSS) for Windows, version 20.0, (SPSS Inc., Chicago, IL, USA). Significance was accepted at P less than 0.05.
RESULTS
Animal growth and blood pressure monitoring
No significant differences were observed during the 9 weeks of treatments for either the control or the CsA (5 mg/kg/day) treated rats (Fig. 1A). However, the animals treated with the higher CsA (30 mg/kg/day) dose lost a significant amount of weight during the first week, thereafter growing but at a slower rate until the final time point. Afterwards, both CsA (5 mg/kg/day) dose reduction, followed by conversion to SRL (1 mg/kg/day) were unable to significantly change the growth rate, which was maintained lower as compared to control throughout the treatment (P <0.001).
 |
Fig. 1. Growth curve, blood pressure evaluation, glucose and lipid metabolism. Body weight (A), heart rate (B), systolic blood pressure (C) diastolic blood pressure (D), fed serum glucose (E), fed insulin (F), fed triglycerides (G) and non-HDL (H), for control, cyclosporine A and the reduction + conversion protocol (0, 3, 6 and 9 weeks). Values are mean ±S.E.M. * P <0.05, ** P<0.01 and *** P<0.001 versus the control group; # P <0.05, ## P <0.01 and ### P <0.001 versus cyclosporine A (5 mg/kg/day). |
Blood pressure and heart rate were evaluated. Rats treated with a CsA (5 mg/kg/day) dose for the entire study period of 9 weeks, presented a continuous and significant increase in the systolic (P <0.001) and diastolic (P <0.05) blood pressures throughout the experimental period, accompanied by tachycardia (P <0.05) (Figs. 1B, 1C and 1D). A second experimental group of rats started the treatment with a higher CsA dose (30 mg/kg/day), demonstrating an even higher increase in blood pressure (systolic and diastolic; P <0.01) and in heart rate (P <0.001). Within the same group, animals were then treated with a significantly lower CsA dose (5 mg/kg/day) for the following 3 weeks, which was able to significantly decreased both blood pressure and heart rate. Moreover, during the last 3 weeks of this treatment protocol, the same group of rats received SRL (1 mg/kg/day), the conversion protocol, which was associated with unchanged blood pressure values, together with a further and significant decrease in heart rate (Figs. 1B, 1C and 1D).
Blood cyclosporine A and sirolimus levels
The trough blood concentration of CsA obtained using the dose of 5 mg/kg/day in the rat was 367.0 ± 45.5 ng/ml, which was within the range achieved in immunosupressive maintenance humans protocols, while for the 30 mg/kg/day dose, mimicking an attack CsA dose, the blood concentration was 1430.2 ± 132.4 ng/ml. In the rats under sirolimus treatment (conversion group, between 6 and 9 weeks), the trough blood levels achieved were 7.8 ± 1.9 ng/ml, similar to levels found in transplanted patients under immunosuppressive therapy with this mTOR inhibitor.
Glucose and lipid metabolism
Regarding glucose metabolism, the rats treated with the lower dose of CsA presented increased glucose levels (P <0.05) and decreased insulin contents (P <0.05), without significant changes of triglycerides and non-HDL levels, when compared to the control animals, at the final time point (week 9) (Fig. 1E-1H). However, the higher CsA dose was associated with a noteworthy increase in triglycerides (P <0.001), non-HDL (P <0.05) and glucose (P <0.01) levels, as well as, a significant reduction of insulin (P <0.001). The CsA dose reduction treatment was able to normalize glucose, triglycerides and non-HDL and stabilized insulin contents, while replacement of CsA for SRL during the last 3 weeks led to a rise in glucose (P<0.05), triglycerides (P <0.001) and non-HDL (P<0.001) contents, and to a complete normalization of insulin levels, versus the control group (Fig. 1E-1H).
Nephrotoxicity evaluation through serum, kidney and urine markers
Classical serum markers of renal function, such as creatinine and BUN (serum, urine content and clearance), as well as, the glomerular filtration rate (GFR), presented only small variations in the group treated with 5 mg/kg/day of CsA throughout the entire 9 week period, versus the control group, in spite of the significant kidney lesions found, which will be described below. However, when the dose of 30 mg/kg/day of CsA was used for the first 3 weeks in another group of animals, the serum concentration of the classical markers of renal function (creatinine and BUN) markedly (P <0.01) increased and their clearance significantly decreased (P <0.01), as well as their GFR (P <0.001) (Fig. 2A-2D and 2G). Following dose reduction from 30 to 5 mg/kg/day for further 3 weeks, these parameters recover to normal values, which were maintained stable also after the conversion to SRL in the last 3 weeks of treatment. Kidney TBARs (P <0.05) and TBAR clearance (P <0.01) also increased after the treatment with the higher CsA dose, and then it stabilized after dose reduction and further conversion to SRL (Fig. 2E and 2F).
 |
Fig. 2. Renal characterization through serum, urine and kidney tissue samples. Serum creatinine (A), urea (C) and their clearances (B, D, respectively), kidney TBARs (E), TBARs clearance (F) and the glomerular filtration rate (G), for control, cyclosporine A and the reduction + conversion protocol (0, 3, 6 and 9 weeks). Values are mean ±SEM. * P <0.05, ** P <0.01 and *** P <0.001 versus the control group; ## P <0.01 and ### P <0.001 versus cyclosporine A (5 mg/kg/day). |
Neutrophil gelatinase-associated lipocalin as a putative kidney nephrotoxicity biomarker after cyclosporine A dose reduction and further conversion to sirolimus
Serum and urine neutrophil gelatinase-associated lipocalin (NGAL) has been described as a putative biomarker of nephrotoxicity. The low CsA dose did not significantly change the urinary contents of NGAL, however, a significant decrease (P <0.01) was found in the group treated with the higher CsA dose (Fig. 3A). On the other hand, long-term CsA treatment (5 mg/kg/day during 9 weeks) was unable to affect both serum and urine NGAL concentrations. However, major changes in NGAL were found in the group with reduction plus conversion to SRL protocol. In fact, at the final time point (9 weeks), significantly increased urine (P <0.001) and serum (P <0.01) NGAL contents were found when compared with the normal levels measured in the control and in the CsA-treated group (Fig. 3B and 3C). Interestingly, while serum and urine NGAL values were found non-correlated (Pearson’s correlation) in the control (r =0.161, P =0.759) and in the CsA (r=0.409, P=0.494) groups, a direct and significant correlation between the concentrations in the two samples was found in the Red + Conv group (r =0.940, P =0.017) (Fig. 3D).
 |
Fig. 3. Serum and urine NGAL as a kidney marker of toxicity. Urine NGAL levels at week 3 (A) and week 9 (B) for the three groups. Serum NGAL (C) and correlation and p value of urine and serum NGAL (D) at week 9. Values are mean ± S.E.M. * P <0.05, ** P <0.01 and *** P <0.001 versus the control group; # P <0.05 and ### P <0.001 versus cyclosporine A (5 mg/kg/day). |
Histomorphological changes of the kidney: glomerular corpuscle, vessels and tubules
Nephrotoxicity was confirmed by two independent pathologists. They characterized each vascular, glomerular and tubular lesion, by examining kidney slices stained with H&E and PAS, and attributing them degrees of severity. After 3 weeks of low dose CsA treatment, only small structural differences were found in tubules and glomerular fields, but the major sign of toxicity was hyperemia, as compared with the control (Fig. 4E). On the other hand, a higher CsA dose was able to induce lesions in all the kidney structures from mild to moderate and even of severe grade. Following only 3 weeks of treatment with the higher CsA dose (30 mg/kg/day) arterioloscleriosis was induced (Fig. 4A), as well as, vascular congestion, hyperemia and arteriosclerosis, as reflected by a total vascular score of moderate grade (Fig. 4F). In addition, it promoted bowman’s capsule thickening (Fig. 4H), vascular pole hyalinization and nodular sclerosis as the main lesions, also further expressing mesangial expansion, glomerular atrophy and thickening of the basement membrane of the glomerulus, resulting all together in a mean glomerular damage of grade 2 (moderate lesions) (Fig. 4L). Furthermore, tubular calcification (Fig. 4N), hyaline cylinders and interstitial fibrosis and tubular atrophy (IFTA) were encountered as major lesion in the tubuluinterstitial field, accompanied by other lesions, such as irregularity of the tubular membrane, vacuolar degeneration, inflammatory infiltration and tubular dilatation, all together expressed in a moderate total tubular grade (Fig. 4R).
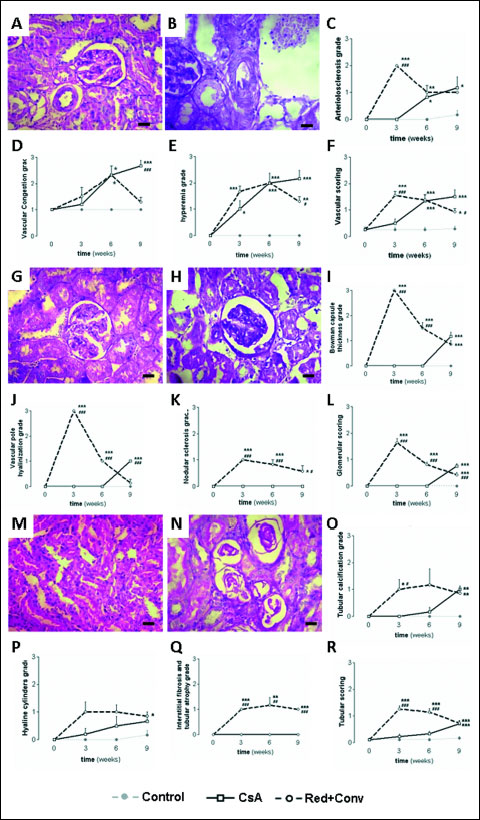 |
Fig. 4. Vascular, glomerular and tubular damage, analyzed among the 9 week treatments. Photomicrographs of the normal kidney arteriole (A) and arteriolosclerosis (B), accompanied by the arteriolosclerosis (C), vascular congestion (D), hyperemia (E) grades and total vascular scoring (F). Photomicrographs of normal glomerular corpuscle (G) and Bowman’s capsule thickness (H), accompanied by the Bowman’s capsule thickness (I), vascular pole hyalinization (J), nodular sclerosis (K) grades and total glomerular scoring (L). Photomicrographs of normal proximal and distal tubules (M) and tubular calcification (N), accompanied by the tubular calcification (O), hyaline cylinders (P), interstitial fibrosis and tubular atrophy (Q) grades and total tubular scoring (R). Values are mean ± S.E.M. * P <0.05, ** P <0.01 and *** P <0.001 versus the control group; # P <0.05, ## P <0.01 and ### P <0.001 versus cyclosporine A (5 mg/kg/day). |
Following CsA dose reduction, amelioration in the global vascular field (mainly arteriolosclerosis) and in the glomerular corpuscle (Bowman’s capsule thickening, vascular pole hyalinization and nodular sclerosis) were observed; however, no significant ameliorations were observed in the tubulointerstitial region, and the most severe kidney lesions, such as tubular calcification and the IFTA, were even worse, indicating that the higher CsA dose can cause irreversible damage in some of the kidney regions/structures. On the other hand, CsA conversion to the mTOR inhibitor, sirolimus, produced a notable amelioration of kidney lesions. In fact, while arteriolosclerosis was the only lesion that remained unchanged, there was a clear improvement on vascular congestion and hyperemia, resulting in a decrease in the total vascular score to mild grade, which was significantly reduced (P <0.05), when compared to the lower CsA dose group. In addition, the conversion protocol presented a decrease in the glomerular lesion grades when compared to the continuous CsA therapy (P <0.001) (Fig. 4L). Moreover, the amelioration was also encountered in the tubular field, with a total tubular score identical to that found in the group under continuous low CsA dose treatment (Fig. 4R).
Collagen deposition in kidney structures
Collagen is the major insoluble fibrous protein in the extracellular matrix and in connective tissue and it can be clearly marked with Masson’s trichrome. Modifications of collagen production reflect cellular changes and consequent kidney dysfunction. In the kidneys from vehicle-treated rats, collagen staining was rare in the glomeruli (Fig. 5E) and a small amount of blue staining appeared in the outer borders tubules (Fig. 5F) and around the vessels. After 3 weeks of CsA low dose monotherapy, no significant changes of collagen deposition were found; however, after 9 weeks, collagen staining was clearly visible in the outer borders of tubular cells (cortex and medulla), well representing wide-spread interstitial fibrosis (Fig. 5H) and Bowman’s capsule thickening also occurred in some glomeruli (Fig. 5G). The use of a higher dose of CsA, even for a short-term treatment, induced profound collagen production and deposition around glomerulus (Fig. 5A) and tubules thus limiting cells functionality (Fig. 5B).
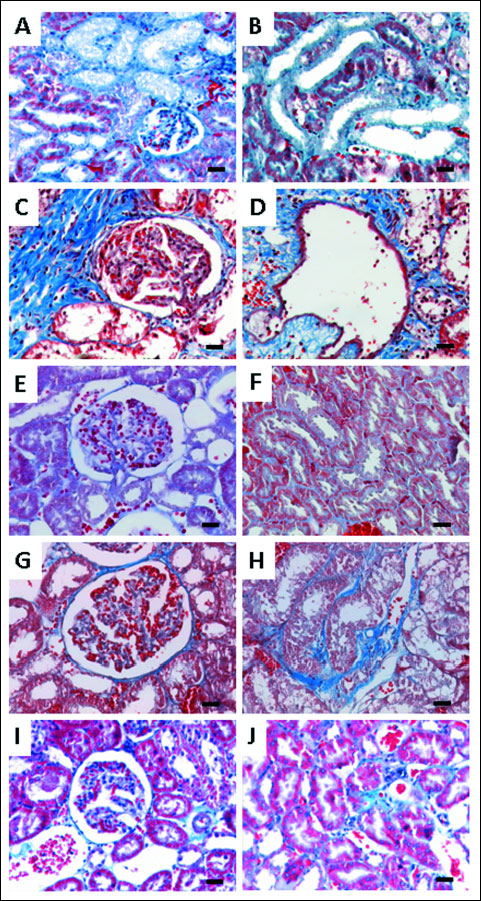 |
Fig. 5. Representative photomicro-graphs of kidney histomorphologic sections using Masson’s trichrome staining for cyclosporine A (30 mg/kg/day) at week 3 (A, F) and cyclosporine A 30 and 5 mg/kg/day at week 6 (B, G). Control (C, H), cyclosporine A (5 mg/kg/day) (D, I) and the reduction + conversion protocol (E, J) groups at 9 weeks of treatments, showing the pattern of collagen deposition (blue color); (C, H) show normal glomerular and tubular regions of the control rats; (A, B, D, E) presents glomerular damage with collagen deposition in glomerulus and around Bowman’s capsules; (F, G, I, J) show collagen deposition inside or around tubules (tubule-interstitial fibrosis). Each bar represents 25 µm magnification. |
CsA dose reduction was associated with an attenuation of staining, with complete abolishment of staining inside the glomerulus and only present around the Bowman’s capsules, suggesting better kidney functionality. In the tubules, hypertrophy and collagen deposition was found, but not inside the epithelium (Fig. 5D), limiting reabsorption and production processes. In the Red + Conv group, kidneys revealed a lower degree of collagen staining with good cellular organization (without atrophic or hypertrophic areas), than that observed in the CsA monotherapy treated rats (Fig. 5I and 5J).
Kidney protein expression by immunohistochemistry
The lower dose of CsA, for a short-term 3 week treatment, increased CTGF, Kim-1, mTOR, NF-κβ1 and TGF-β (P <0.001) kidney protein expression, when compared to the control rats. The higher CsA dose also promoted an overexpression of all the proteins, and even greater when compared to the lower CsA dose for CTGF (P <0.001), Kim-1 (P <0.01) and mTOR (P <0.001) (Figs. 6 and 7). Long-term treatment with the lower CsA dose promoted increased expression of CTGF, mTOR and TGF-β versus the control group, while kidney Kim-1, NF-κβ1 and PCNA expression was unchanged. After the CsA dose reduction and replacement to SRL, kidney tissue presented increased immunoreactivity for CTGF when compared to the control and CsA monotherapy groups (P <0.001). Moreover, while the expression of mTOR and TGF-β was similar, when compared with the CsA monotherapy, decreased expression of NF-κβ1 (P <0.001) and PCNA (P <0.05) was observed (Figs. 6 and 7).
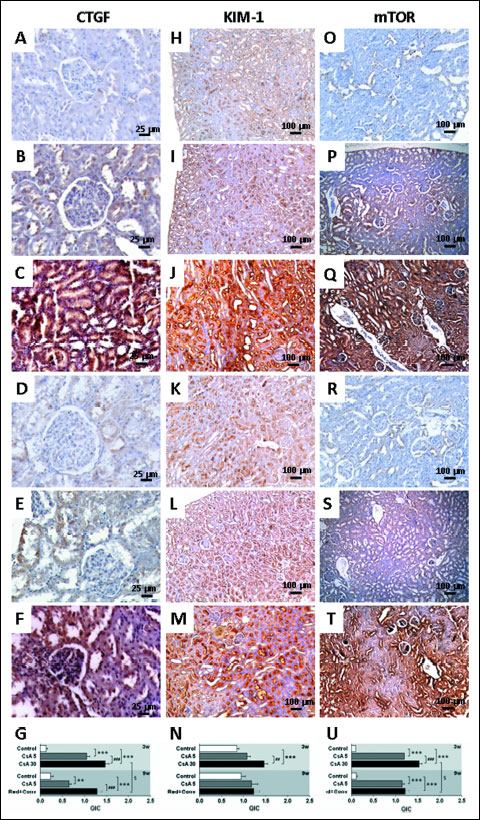 |
Fig. 6. Kidney protein expression by immunohistochemistry. Connective tissue growth factor - CTGF (A, B, C, D, E, F), kidney injury molecule-1 - KIM-1 (H, I J, K, L, M) and mammalian target of rapamycin - mTOR (O, P, Q, R, S, T). Images A, H and O represents control; B, I and P represents CsA (5 mg/kg/day) and C, J represents cyclosporine A (30 mg/kg/day) at week 3. D, K and R represents control; images E, L and S represents cyclosporine A 5 mg and and F, M and T represents the reduction + conversion protocol at week 9. Staining area and intensity (QIC) quantification for each represented protein (G, N, U), respectively. Values are mean ± S.E.M. ** P <0.01 and *** P <0.001 versus the control group; ## P <0.01 and ### P <0.001 versus cyclosporine A (5 mg/kg/day); §P <0.05 versus cyclosporin (30 mg/kg/day). |
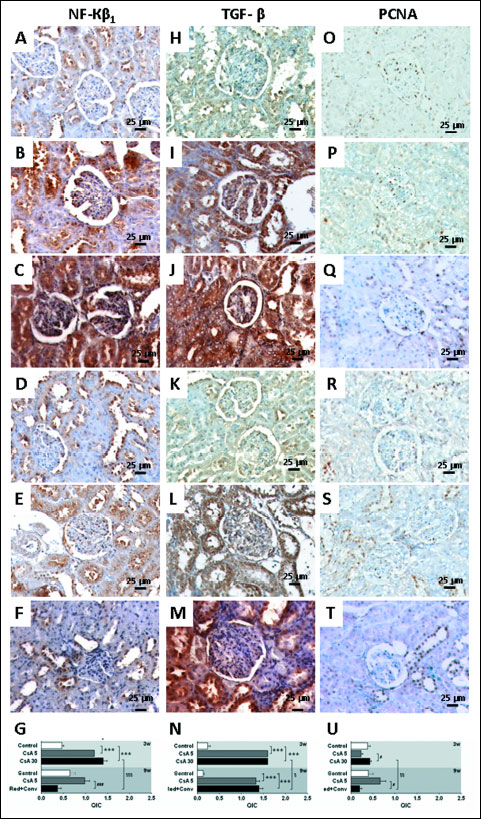 |
Fig. 7. Kidney protein expression by immunohistochemistry. Nuclear factor kappa beta-1 - NF-κβ1 (A, B, C, D, E, F), transforming growth factor beta - TGF-β (H, I J, K, L, M) and proliferating cell nuclear antigen-PCNA (O, P, Q, R, S, T). Images A, H and O represents control; B, I and P represents CsA 5 mg and C, J represents CsA (30 mg/kg/day) at week 3. D, K and R represents control; images E, L and S represents cyclosporine A 5 mg and and F, M and T represents the reduction + conversion protocol at week 9. Staining area and intensity (QIC) quantification for each represented protein (G, N, U), respectively. Values are mean ± S.E.M. *** P <0.001 versus the control group; # P <0.05 and ### P <0.001 versus cyclosporine A (5 mg/kg/day); § P <0.05, §$ P <0.01 and §$$ P <0.001 versus cyclosporine A (30 mg/kg/day). |
DISCUSSION
The poor sensitivity of the traditional nephrotoxicity markers is one of the main weakness identified by the medical community, which include serum creatinine and BUN levels, clearly reflecting only 70–80% of the renal epithelial mass damage that has been lost (28, 29). The demand for important putative markers in non-invasive samples, such as urine, has been pointed as a choice to access drug-related toxicity, but urine has also some limitations, because detection of enzymes and other proteins can be difficult due to their instability and high variability (29). The current study intended to clarify the evolution of nephropathy in a protocol of CsA dose reduction followed by conversion to sirolimus in the rat, using serum, urine and renal samples to access the importance of emergent biomarkers of renal damage. Recognizing that no experimental model could completely match the clinical situation, we opted to use a rat model with native kidneys to study the direct impact of this immunosuppressive therapy protocol on markers of oxidative stress, inflammation, proliferation and fibrosis, thus avoiding additional interferences of a manipulated model, such as the salt-depletion, unilateral nephrectomized and bilateral adrenalectomized rats used in other studies, namely those interested in the evaluation of the contribution of renin-angiotensin-aldosterone system.
The CsA maintenance dose does not affected body weight throughout the treatment, while the higher CsA dose provoked evident weight loss in the rats already in the first week, thereafter, the rats showed some degree of body weight recovery. The body weight loss could be attributed to diarrhoea suffered by the animals under the higher CsA dose treatment, and this effect subsided after dose reduction. On the other hand, CsA replacement by SRL maintained the slower rate of body weight gain, which might be due to the anti-proliferative properties of SRL. Our group demonstrated using the CsA maintenance dose of 5 mg/kg/day in the rat, that some of the serious side-effects of CsA, including hypertension and dyslipidaemia, are already present after only 2 weeks of treatment and lasts for 7 weeks (30). The present work reinforces these data, additionally demonstrating that the effects were aggravated during a longer exposure (9 weeks). These effects included continuous increase in systolic and diastolic blood pressure throughout the time course. Starting the immunosuppressive treatment with a higher CsA dose resulted in a remarkable increase in heart rate and BP (systolic and diastolic) to values even superior to those found after 6 weeks with a lower CsA dose. Interestingly, dose reduction promoted reduction of BP and then conversion to SRL further reduced heart rate for normal values. However, BP values were unable to be normalized and a trend to increased BP was found. In other conversion model without an initial period of CsA at higher dose, SRL promoted blood pressure rise in an early conversion protocol, as well as in monotherapy (25). The mechanisms underlying CsA-induced hypertension have been described as multifactorial (31-36); however, several lines of evidences have been suggesting that the renal vasomotor disequilibrium could be the main origin of both hypertension and nephropathy (37, 38). In fact, as Lassila et al. previously showed, CsA-evoked hypertension and nephrotoxicity is accompanied by functional and structural changes on systemic and renal arteries and arterioles (38).
Regarding glucose and lipid metabolism, recent studies with ex vivo treatment of fat cells, as well as an in vivo study in rats using CsA, showed impaired insulin-stimulated glucose uptake by adipocytes, causing glucose intolerance, which could be responsible for the development of post-transplantation diabetes (39-41). In our model, the CsA monotherapy was able to increase fed blood glucose levels in the 9 weeks treatment, accompanied by decreased insulin content. However, 30 mg/kg/day of CsA treatment after only 3 weeks caused significant increased blood glucose levels and reduced insulin concentrations, together with significant increase in serum triglycerides and non-HDL cholesterol levels. Dose reduction normalized glucose, triglycerides and non-HDL contents and inhibited insulin decrease. When CsA was replaced by SRL, glucose, triglycerides and non-HDL cholesterol levels increased again by 2 fold. Recently, it was reported that SRL induced metabolic alterations in both short- and long-term treatments in the liver, skeletal muscle and adipose tissues in rats (41, 42), which is in agreement with our results and with the clinical practice in humans.
During the renal biochemical characterization, we found that the serum markers of renal dysfunction (GFR, serum and clearances of creatinine and BUN) are unable to fully express the genuine status of the kidney function/damage in the CsA (5 mg/kg/day) treatment, because no significant differences were found in these traditional markers at the final time point, despite the renal lesions clearly identified. However, kidney lipid peroxidation increased at the end of the treatment when lesions were more evident in both glomerulus and tubules. In addition, a slight increase in serum creatinine and BUN after the third week of CsA therapy was found, but very slight changes in tissue structure were found. Nevertheless, 30 mg/kg/day of CsA for only 3 week could decrease GFR and clearances to less than half of the control values, together with increased serum levels of creatinine and BUN, accompanied by elevation of kidney TBARs and their clearance. Furthermore, high content of urine MDA was previously reported in transplanted patients, but the authors were unable to explain its importance (43). Our data suggests that clearance and kidney levels of MDA could putatively be viewed as predictive markers of CsA-induced nephrotoxicity, as the variations appeared when kidney lesions were expressed. The presence of an intact NO/cGMP system confers renoprotection against drug-induced nephrotoxicity, as previously suggested (44). In fact, oxidative stress can promote the formation/release of a variety of vasoactive mediators (45) that can affect renal function directly by causing renal vasoconstriction or decreasing the glomerular capillary ultrafiltration coefficient, thus reducing the GFR. Moreover, GFR is directly mediated by AKT through mTOR that has a direct role in glomerular barrier integrity, thus explaining the decrease in GFR (46). In general, the CsA dose reduction normalized the serum and clearance parameters, as well as, kidney TBARs and their clearance. The CsA conversion to SRL maintained these markers levels, although somehow higher than those found in the control animals. SRL has been described as promoter of urine protein increase, but the relationship between proteinuria and the SRL-evoked effects on renal function is unclear and complex, limiting proteinuria power as an early marker of renal dysfunction or damage (24).
During the last years, there have been efforts to identify better and more accurate biomarkers for acute CsA-induced nephrotoxicity. Gelatinase-associated lipocalin (NGAL) has been indicated as an acute marker of nephrotoxicity. Furthermore, NGAL in the urine and plasma could have a 10,000-fold and 100-fold concentration rise, respectively, from normal levels in cases of renal injury (47, 48). This could make NGAL a potentially sensitive marker for the different degrees of renal wounds. However, 3 and 9 weeks of low CsA dose treatments (already nephrotoxic) were unable to promote changes in serum and urine NGAL levels; yet, after 3 weeks of higher CsA dose treatments there was a significant decrease of urine NGAL content, an effect that was abolished at 9 weeks (after both CsA dose reduction during 3 weeks and followed by conversion to SRL for an additional 3 weeks), as viewed by the simultaneous and proportional increase of serum and urine NGAL contents. Moreover, urine NGAL and serum levels presented a remarkable correlation in the Red + Conv protocol group (r = 0.040, P = 0.017). Interestingly, in another model previously tested (Sereno et al., (26)), in a protocol of early CsA conversion to SRL in the rat, identical linearity between urine NGAL and serum contents was found, accompanied by proteinuria, thus suggesting that urine and serum NGAL levels could be viewed as good markers of renal dysfunction and evolution in protocols with conversion to SRL. This mTOR inhibitor is described in the literature as a less nephrotoxic agent than the calcineurin inhibitors, but one of the effects better described is the development of SRL-evoked proteinuria (49, 50). Moreover, mTOR inhibition by rapamycin has a role in protein transport because it reduces tubular protein reabsorption that contributes to increase urinary protein levels (51). In a previous study, we showed that a longer (9 weeks) SRL treatment in the rat caused proteinuria (26).
Regarding renal pathology characterization, we found that vessels are the first renal structures affected by the low doses of CsA, after only 3 weeks of treatment, as shown by the presence of some lesions, such as vascular hyperemia and arteriolar vacuolization, that might be related to hypertension appearance; the lesions were further aggravated with prolonged CsA exposure, with a total vascular score mild-to-moderate. This data complement previous information suggesting that the first CsA pathologic events are related to afferent arteriolar vasoconstriction, thrombotic microangiopathy and isomeric tubular vacuolization (52). In addition, acute CsA events are related to decreased vasodilation and free radical formation, which are among the main mechanism underlying development of hypertension and decreased GFR (53). GFR is one of the markers that change in the treatment with higher doses of CsA. Moreover, in this treatment, moderate grade of vascular lesion appeared in a short period of treatment, then recovering slightly after CsA dose reduction and additionally (mild grade) when CsA was completely replaced by sirolimus. SRL has been described as a less nephrotoxic agent than CsA (20), which explains the fact that mTOR inhibitors have been used to replace CsA (9, 11). In respect to the glomerular region, only mild lesions appeared in the end of the CsA monotherapy. However, in the Red + Conv protocol, at week 3, most of the lesions analyzed presented a moderate-to-severe grade, such as Bowman’s capsule thickening and vascular hyalinization. Nodular sclerosis was graded only as mild, but this is an advanced lesion found in extended chronic renal disease. This lesion represents the irreversible and progressive loss of nephrons that ultimately results in glomerular sclerosis, tubular atrophy and further reductions in nephron numbers (54). CsA dose reduction was associated with a recovering of kidney structure as viewed by the reduced grades of all lesions. After CsA conversion to SRL, additional benefits were obtained, viewed by a total score between absent and mild. Concerning the tubulointerstitial region, one again, CsA (5 mg/kg/day) monotherapy induce mild lesions while 30 mg/kg/day of CsA caused more severe lesion in only 3 weeks of treatment. CsA dose reduction was unable to promote significant recover in tubulointerstitial structures, but CsA conversion to SRL was able to ameliorate those lesions.
In this study we also have evaluate kidney fibrosis, which is one of the most severe consequences of CsA use, by using Masson’s tricrome staining that shows collagen deposition. Most of collagen formation and deposition occurs around the tubules, limiting their functionality. We found kidney fibrosis in the rats under CsA (5 mg/kg/day) monotherapy only at week nine and at a low grade, able to be reversible and kidney function restored. However, a severe degree of fibrosis was found in the rats under high CsA dose in all structures (vessels, glomerules and tubules), thus limiting filtration, secretion and reabsorption. CsA dose reduction promoted kidney amelioration, which was reinforced by the reduced collagen deposition. In fact, podocytes presented absent or slight staining and collagen deposition was located around tubules but not inside the cells. CsA replacement by SRL almost completely abolished collagen deposition. The improvement of kidney fibrosis (which is viewed as a common final pathway of calcineurin allograft nephropathy) evoked by SRL might be due to the anti-proliferative properties of SRL beyond immunosuppression. In fact, in opposition to CsA, SRL is able to inhibit epithelial-to-mesenchymal transition (20).
CTGF is a polypeptide implicated in the extracellular matrix synthesis that belong to a pro-fibrotic signalling (TGF-b1 downstream modulator) and has been pointed as a possible biomarker of CsA-evoked damage. In our model, kidney CTGF expression increased after the short-term treatment with CsA, but mainly in the higher dose. After a longer CsA exposure (with a lower dose) the kidney expression of CTGF was slightly reduced, which might be explained by an increased urinary elimination, as previously suggested by O’Connell et al. in another experimental study (24). In the kidney of the rats under the Red + Conv protocol, kidney CTGF expression was reduced, which could be related with the decrease of fibrosis and collagen deposition; however, the expression was not normalized and CTGF staining was found in the glomerulus and some tubules, suggesting that, once again, some of the lesions induced by CsA are maintained after the conversion for SRL.
During the last years several toxicological studies have been focused on evaluating hypothetical biomarkers that could predict acute nephropathy (29, 55, 56). Due to its functional reserve, minor effects on kidney function are too difficult to detect. Kim-1 is a type 1 transmembrane protein expressed in the proximal tubules and further excreted in the urine; in the last years, Kim-1 has been pointed as a possible marker of renal injury in acute models. This factor has a role in proliferation and tissue repair (28, 57) because it confers phagocytic capacity to clear cell debris (58). Kim-1 staining occurred in proximal tubule epithelial cells, a sensitive tissue to drugs and their metabolites. In our study, after 3 weeks of CsA treatment, intense Kim-1 staining was found in the proximal tubules, but mainly in the higher CsA dose. Although this protein might be viewed as a putative good marker for CsA toxicity in the presence of acute mild-to-moderate lesions, cannot be considered a good biomarker of chronic nephrotoxicity since the expression was reduced in long-term CsA therapy as well as in the Red + Conv group at the final time point. However, since Kim-1 has a role in tissue repair, the reduction of Kim-1 expression in the Red + Con group reinforces the suggestion that CsA dose reduction and then conversion to SRL are renoprotective.
Current theories point to the fact that renal damage is caused by non-immunological factors, such as ischemia, which leads to activation of various pro-inflammatory and pro-fibrotic mediators. A parallel concept of how CsA might induce renal injury was described by Li and Yang (59), suggesting that kidney damage involves activation of the innate immune response that causes NF-κβ activation and induces dendritic cell maturation and T-lymphocyte infiltration into the graft, both pathways ultimately resulting in interstitial inflammation and interstitial fibrosis that contributes to chronic nephropathy. In agreement, our data confirm that CsA toxicity might starts with increased NF-κβ1 and protein (immunohistochemistry) overexpression after 3 weeks of CsA treatment with either dose; an effect that is then down-regulated with prolonged exposure of a low dose of CsA and after conversion to SRL. Recent results indicate decreased kidney expression of NF-κβ1 in a time dependent manner, suggesting that the reduction found in the Red + Conv protocol in the current study could be a direct effect of SRL under CsA exposure, thus indicating that this nuclear factor could have an important impact in the development of nephrotoxicity (26). Additionally, in this present study, the short-term CsA dose treatment wasn’t associated with increased expression of PCNA in the kidney tissue, which has been identified as the key mediator of fibrosis and proliferation (59). However, a longer treatment with the lower CsA dose promoted an increase in PCNA immunostaining, which is coincides with the appearance of kidney lesions. After CsA dose reduction and then substitution for SRL, low levels of this nuclear factor were found, in agreement with the reduced NF-κβ1 after switching to SRL therapy.
TGF-β has been described in the last decades as a prominent growth factor that leads to CsA-induced nephrotoxicity, reinforced by the protective effect of peroxisome-proliferator-activated receptors gamma agonists rosiglitazone and 15-deoxy-D12,14-prostaglandin J2 against CsA-induced injury in the Wistar rat kidneys (60). Our results are in agreement with this argument. During prolonged CsA exposure, nephrotoxicity evolves, as viewed by the increased degree of histological lesions, which seems to be associated with other molecular pathways and mediators. In fact, in our model there was a significant kidney overexpression of mTOR, a serine/threonine protein kinase which has a major role in the regulation of cell growth, proliferation, motility, survival, protein synthesis and transcription (61). More interestingly, SRL use after CsA-based protocol reduced significantly the expression of mTOR in agreement with the reduction of lesions. As Lieberthal and Levine (62) demonstrated, mTOR plays an important role in mediating the process of regeneration and recovery, depending on the kidney damage extension. In agreement, mTOR inhibition has been associated with amelioration of kidney fibrosis, glomerulosclerosis and interstitial inflammation, having an important role in distinct renal diseases (63, 64). In this model, protein immunostaining reveals increased mTOR in the CsA-treated rats, resulting in podocyte epithelial-to-mesenchymal transition, leading to glomerular damage (65). In addition, we have previously shown that SRL did not increase kidney mTOR expression in a short treatment (26), which might explain the attenuation of lesions found at the end of the protocol of Red + Conv protocol. As we showed, rapamycin is less fibrogenic than CsA, because it demonstrated kidney improvement through detracted kidney fibrosis and glomerular damage in a protocol of CsA dose reduction followed by complete replacement by SRL. Clearly, our results reinforce the rationale for the substitution of CsA by SRL when immunosuppression is well controlled and is not an obstacle, not only because longer and/or higher dose CsA exposure protocols are notoriously more deleterious, promoting structural kidney deterioration, but also because mTOR overexpression seems to be a feature of chronic CsA-nephropathy.
This study demonstrated that CsA-induced nephrotoxicity is significantly aggravated over time and it is dose dependent. The current clinical analyses and biomarkers used, particularly of biochemical impairment (serum and urine creatinine and BUN levels, as well as clearance), if coupled with protein analysis in the different samples, will bring more accuracy and earlier detection of renal injury. Our data suggest that emergent non-traditional factors/mediators could be viewed as better biomarkers: - CTGF and KIM-1, NF-κβ, TGF-β, and mTOR for the evolution of CsA-induced nephrotoxicity and - NGAL for follow-up the renal function and lesion after conversion from CsA to SRL. To conclude, CsA nephrotoxicity is dose dependent and moderate dysfunction could be ameliorated/prevented by SRL conversion, which could be pivotal for the preservation of kidney function and structure.
Acknowledgments: This work was supported by the Portuguese Foundation for Science and Technology (FCT) and COMPETE-FEDER: PhD Grant SFRH/BD/63962/2009 and Strategic Projects Pest/C/SAU/3282/2011-2013, PEst-C/SAU/LA0001/2013 and PEst-OE/CED/UI4016/2014 (CI&DETS) and UID/NEU/04539/2013. The authors also acknowledge the GIFT/SPD award.
Conflict of interests: None declared.
REFERENCES
- Boissonnat P, Gaillard S, Mercier C, et al. Impact of the early reduction of cyclosporine on renal function in heart transplant patients: a French randomised controlled trial. Trials 2012; 13: 231.
- Young EW, Ellis CN, Messana JM, et al. A prospective study of renal structure and function in psoriasis patients treated with cyclosporin. Kidney Int 1994; 46: 1216-1222.
- Lebranchu Y, Thierry A, Thervet E, et al. Efficacy and safety of early cyclosporine conversion to sirolimus with continued MMF-four-year results of the Postconcept study. Am J Transplant 2011; 11: 1665-1675.
- ter Meulen CG, van Riemsdijk I, Hene RJ, et al. Steroid-withdrawal at 3 days after renal transplantation with anti-IL-2 receptor alpha therapy: a prospective, randomized, multicenter study. Am J Transplant 2004; 4: 803-810.
- Manito N, Rabago G, Palomo J, et al. Improvement in chronic renal failure after mycophenolate mofetil introduction and cyclosporine dose reduction: four-year results from a cohort of heart transplant recipients. Transplant Proc 2011; 43: 2699-26706.
- Sanchez-Pozos K, Lee-Montiel F, Perez-Villalva R, et al. Polymerized type I collagen reduces chronic cyclosporine nephrotoxicity. Nephrol Dial Transplant 2010; 25: 2150-2158.
- Dummer CD, Carpio VN, Goncalves LF, Manfro RC, Veronese FV. FOXP3+ regulatory T cells: from suppression of rejection to induction of renal allograft tolerance. Transpl Immunol 2012; 26: 1-10.
- Barbari AG, Stephan AG, Masri MA. Calcineurin inhibitor-free protocols: risks and benefits. Saudi J Kidney Dis Transpl 2007; 18: 1-23.
- Mota A. Sirolimus: a new option in transplantation. Expert Opin Pharmacother 2005; 6: 479-487.
- Gordois A, Nobes M, Toohey M, Russ G. Cost-effectiveness of sirolimus therapy with early cyclosporin withdrawal vs. long-term cyclosporin therapy in Australia. Clin Transplant 2006; 20: 526-536.
- Campistol JM, Cockwell P, Diekmann F, et al. Practical recommendations for the early use of m-TOR inhibitors (sirolimus) in renal transplantation. Transpl Int 2009; 22: 681-687.
- Kahan BD, Julian BA, Pescovitz MD, Vanrenterghem Y, Neylan J. Sirolimus reduces the incidence of acute rejection episodes despite lower cyclosporine doses in caucasian recipients of mismatched primary renal allografts: a phase II trial. Rapamune Study Group. Transplantation 1999; 68: 1526-1532.
- de Sevaux RG, Gregoor PJ, Hene RJ, et al. A controlled trial comparing two doses of cyclosporine in conjunction with mycophenolate mofetil and corticosteroids. J Am Soc Nephrol 2001; 12: 1750-1757.
- Gonwa TA, Hricik DE, Brinker K, Grinyo JM, Schena FP, Sirolimus Renal Function Study Group. Improved renal function in sirolimus-treated renal transplant patients after early cyclosporine elimination. Transplantation 2002; 74: 1560-1567.
- Muhlbacher F, Paczek L. An open-label study to evaluate the efficacy and safety of cyclosporine reduction in de novo renal allograft recipients receiving sirolimus: a dose comparative study. Am J Transplant 2002; 3: S238.
- Cohen DJ, Vincenti F. A comparative open label study to evaluate graft function in de novo renal allograft recipients treated with reduced dose or standard dose cyclosporine in combination with sirolimus and corticosteroids. Am J Transplant 2003; 5: S465.
- Weir MR, Diekmann F, Flechner SM, et al. mTOR inhibition: the learning curve in kidney transplantation. Transpl Int 2010; 23: 447-460.
- Chung BH, Lim SW, Doh KC, Piao SG, Heo SB, Yang CW. Human adipose tissue derived mesenchymal stem cells aggravate chronic cyclosporin nephrotoxicity by the induction of oxidative stress. PLoS One 2012; 8: e59693.
- Hu SU, Fernandez R, Jones JW Jr. Cyclosporine A stimulates proliferation of vascular smooth muscle cells and enhances monocyte adhesion to vascular smooth muscle cells. Transplant Proc 1997; 31: 663-665.
- Luo L, Sun Z, Luo G. Rapamycin is less fibrogenic than cyclosporin A as demonstrated in a rat model of chronic allograft nephropathy. J Surg Res 2013; 179: e255-63.
- O’Connell S, Tuite N, Slattery C. Ryan MP, McMorrow T. Cyclosporine A-induced oxidative stress in human renal mesangial cells: a role for ERK 1/2 MAPK signaling. Toxicol Sci 2012; 126: 101-113.
- Reis F. The unsolved cyclosporine-induced kidney injury: is paricalcitol a feasible new renoprotective option? Kidney Int 2010; 77: 1055-1057.
- Hesselink DA, Bouamar R, Van Gelder T. The pharmacogenetics of calcineurin inhibitor-related nephrotoxicity. Ther Drug Monit 2010; 32: 387-393.
- O’Connell S, Slattery C, Ryan MP, McMorrow T. Identification of novel indicators of cyclosporine A nephrotoxicity in a CD-1 mouse model. Toxicol Appl Pharmacol 2011; 252: 201-210.
- Sereno J, Romao AM, Parada B, et al. Cardiorenal benefits of early versus late cyclosporine to sirolimus conversion in a rat model. J Pharmacol Pharmacother 2012; 3: 143-148.
- Sereno J, Nunes S, Rodrigues-Santos P, et al. Conversion to sirolimus ameliorates cyclosporine-induced nephropathy in the rat: focus on serum, urine, gene, and protein renal expression biomarkers. Biomed Res Int 2014; 2014: 576929.
- Pestel S, Krzykalla V, Weckesser G. Measurement of glomerular filtration rate in the conscious rat. J Pharmacol Toxicol Methods 2007; 56: 277-289.
- Han WK, Bailly V, Abichandani R, Thadhani R, Bonventre JV. Kidney Injury Molecule-1 (KIM-1): a novel biomarker for human renal proximal tubule injury. Kidney Int 2002; 62: 237-244.
- Rached E, Hoffmann D, Blumbach K, Weber K, Dekant W, Mally A. Evaluation of putative biomarkers of nephrotoxicity after exposure to ochratoxin A in vivo and in vitro. Toxicol Sci 2008; 103: 371-381.
- Reis F, Tavares P, Rito LC, et al. Platelet activation is increased in cyclosporin A-induced hypertensive rats. J Cardiovasc Pharmacol 2000; 36: 56-64.
- Reis F, Rocha L, Ponte L, et al. Effect of preventive and regressive isosorbide 5-mononitrate treatment on catecholamine levels in plasma, platelets, adrenals, left ventricle and aorta in cyclosporin A-induced hypertensive rats. Life Sci 2005; 77: 2514-2528.
- Sander M, Lyson T, Thomas GD, Victor RG. Sympathetic neural mechanisms of cyclosporine-induced hypertension. Am J Hypertens 1996; 9: 121S-138S.
- Reis F, Tavares P, Fontes Ribeiro CA, Antunes F, Teixeira F. The peripheral serotonergic system and platelet aggregation in cyclosporin A-induced hypertensive rats. Thromb Res 1999; 96: 365-372.
- Reis F, Almeida L, Alcobia T, et al. Isosorbide-5-mononitrate treatment prevents cyclosporin A-induced platelet hyperactivation and the underlying nitric oxide-cyclic guanosine-3’,5’-monophosphate disturbances. Thromb Res 2003; 110: 107-115.
- Lassila M. Interaction of cyclosporine A and the renin-angiotensin system; new perspectives. Curr Drug Metab 2002; 3: 61-71.
- Reis F, Rocha-Pereira P, Teixeira de Lemos E, et al. Oxidative stress in cyclosporine-induced hypertension: evidence of beneficial effects or tolerance development with nitrate therapy. Transplant Proc. 2007; 39: 2494-2500.
- Zhang W, Victor RG. Calcineurin inhibitors cause renal afferent activation in rats: a novel mechanism of cyclosporine-induced hypertension. Am J Hypertens 2000; 13: 999-1004.
- Lassila M, Santisteban J, Finckenberg P, et al. Vascular changes in cyclosporine A-induced hypertension and nephrotoxicity in spontaneously hypertensive rats on high-sodium diet. J Physiol Pharmacol 2001; 52: 21-38.
- Lopes P, Fuhrmann A, Sereno J, et al. Effects of cyclosporine and sirolimus on insulin-stimulated glucose transport and glucose tolerance in a rat model. Transplant Proc 2013; 45: 1142-1148.
- Pereira MJ, Palming J, Rizell M, et al. The immunosuppressive agents rapamycin, cyclosporin A and tacrolimus increase lipolysis, inhibit lipid storage and alter expression of genes involved in lipid metabolism in human adipose tissue. Mol Cell Endocrinol 2013; 365: 260-269.
- Fuhrmann A, Lopes P, Sereno J, et al. Molecular mechanisms underlying the effects of cyclosporin A and sirolimus on glucose and lipid metabolism in liver, skeletal muscle and adipose tissue in an in vivo rat model. Biochem Pharmacol 2014; 88: 216-228.
- Lopes PC, Fuhrmann A, Sereno J, et al. Short and long term in vivo effects of cyclosporine A and sirolimus on genes and proteins involved in lipid metabolism in Wistar rats. Metabolism 2014; 63: 702-715.
- Knight JA, Cheung AK, Pieper RK, Servilla K. Increased urinary lipoperoxide levels in renal transplant patients. Ann Clin Lab Sci 1989; 19: 238-241.
- Helmy MW, Helmy MM, Abd Allah DM, Abo Zaid AM, Mohy El-Din MM. Role of nitrergic and endothelin pathways modulations in cisplatin-induced nephrotoxicity in male rats. J Physiol Pharmacol 2014; 65: 393-399.
- Garcia-Cohen EC, Marin J, Diez-Picazo LD, Baena AB, Salaices M, Rodriguez-Martinez MA. Oxidative stress induced by tert-butyl hydroperoxide causes vasoconstriction in the aorta from hypertensive and aged rats: role of cyclooxygenase-2 isoform. J Pharmacol Exp Ther 2000; 293: 75-81.
- Vassiliadis J, Bracken C, Matthews D, O’Brien S, Schiavi S, Wawersik S. Calcium mediates glomerular filtration through calcineurin and mTORC2/Akt signaling. J Am Soc Nephrol 2011; 22: 1453-1461.
- Mishra J, Ma Q, Prada A, et al. Identification of neutrophil gelatinase associated lipocalin as a novel early urinary biomarker for ischemic renal injury. J Am Soc Nephrol 2003; 14: 2534-2543.
- Mishra J, Mori K, Ma Q, Kelly C, Barasch J, Devarajan P. Neutrophil gelatinase-associated lipocalin: a novel early urinary biomarker for cisplatin nephrotoxicity. Am J Nephrol 2004; 24: 307-315.
- Cai Y, Chen Y, Zheng S, Chen B, Yang Y, Xia P. Sirolimus damages podocytes in rats with protein overload nephropathy. J Nephrol 2011; 24: 307-312.
- Cina DP, Onay T, Paltoo A, et al. MTOR regulates autophagic flux in the glomerulus. Autophagy 2012; 8: 696-698.
- Straathof-Galema L, Wetzels JF, Dijkman HB, Steenbergen EJ, Hilbrands LB. Sirolimus-associated heavy proteinuria in a renal transplant recipient: evidence for a tubular mechanism. Am J Transplant 2006; 6: 429-433.
- Naesens M, Kuypers DR, Sarwal M. Calcineurin inhibitor nephrotoxicity. Clin J Am Soc Nephrol 2009; 4: 481-508.
- Roullet JB, Xue H, McCarron DA, Holcomb S, Bennett WM. Vascular mechanisms of cyclosporin-induced hypertension in the rat. J Clin Invest 1994; 93: 2244-2250.
- Remuzzi G, Bertani T. Pathophysiology of progressive nephropathies. N Engl J Med 1998; 339: 1448-1456.
- Fuchs TC, Hewitt P. Biomarkers for drug-induced renal damage and nephrotoxicity-an overview for applied toxicology. AAPS J 2011; 13: 615-631.
- Urbschat A, Obermuller N, Haferkamp A. Biomarkers of kidney injury. Biomarkers 2011; 16 (Suppl. 1): S22-S30.
- Ichimura T, Hung CC, Yang SA, Stevens JL, Bonventre JV. Kidney injury molecule-1: a tissue and urinary biomarker for nephrotoxicant-induced renal injury. Am J Physiol Renal Physiol 2004; 286: F552-F563.
- Hoffmann D, Fuchs TC, Henzler T, et al. Evaluation of a urinary kidney biomarker panel in rat models of acute and subchronic nephrotoxicity. Toxicology 2010; 277: 49-58.
- Li C, Yang CW. The pathogenesis and treatment of chronic allograft nephropathy. Nat Rev Nephrol 2009; 5: 513-519.
- Korolczuk A, Maciejewski M, Smolen A, Dudka J, Czechowska G, Widelska I. The role of peroxisome-proliferator-activating receptor gamma agonists: rosiglitazone and 15-deoxy-delta(12,14)-prostaglandin J2 in chronic experimental cyclosporine A-induced nephrotoxicity. J Physiol Pharmacol 2014; 65: 867-876.
- Feng Z, Zhang H, Levine AJ, Jin S. The coordinate regulation of the p53 and mTOR pathways in cells. Proc Natl Acad Sci USA 2005; 102: 8204-8209.
- Lieberthal W, Levine JS. The role of the mammalian target of rapamycin (mTOR) in renal disease. J Am Soc Nephrol2009; 20: 2493-2502.
- Chen G, Chen H, Wang C, et al. Rapamycin ameliorates kidney fibrosis by inhibiting the activation of mTOR signaling in interstitial macrophages and myofibroblasts. PLoS One 2012; 7: e33626.
- Kramer S, Wang-Rosenke Y, Scholl V, et al. Low-dose mTOR inhibition by rapamycin attenuates progression in anti-thy1-induced chronic glomerulosclerosis of the rat. Am J Physiol Renal Physiol 2008; 294: F440-F449.
- Inoki K, Mori H, Wang J, et al. mTORC1 activation in podocytes is a critical step in the development of diabetic nephropathy in mice. J Clin Invest 2011; 121: 2181-2196.
A c c e p t e d : February 13, 2015