TRANSCRIPTION FACTOR GATA3 EXPRESSION IS INDUCED BY GLS2 OVEREXPRESSION IN A GLIOBLASTOMA CELL LINE BUT IS GLS2-INDEPENDENT IN PATIENT-DERIVED GLIOBLASTOMA
INTRODUCTION
Glioblastoma multiforme (GBM, WHO grade IV) belongs to the most malignant primary brain tumors with very poor prognosis (1). Glutamine (Gln) is a versatile amino acid promoting hallmarks of malignancy (2). Phosphate-activated glutaminase (GA, EC 3.5.1.2) metabolizes Gln to glutamate (Glu) and ammonia and thus plays a significant role in tumor biology. Human GA is encoded by two genes: GLS encodes kidney-type isoforms and GLS2 encodes liver type isoforms (3). So far, two transcripts arising from each of GA genes have been identified: KGA and GAC for GLS and GAB and LGA for GLS2 (3).
Different studies revealed that glutaminase isoforms play opposite roles in tumorigenesis. GLS isoforms are associated with high rate of cell proliferation, whereas GLS2 proteins are related to resting or quiescent cell states (4). Suppression of the malignant phenotype can be obtained by inhibition of GLS (5-7) or overexpression of GLS2 (8, 9). Of note, the GLS gene has been shown to be regulated by the mediators of oncogenesis, MYC (10), Rho GTPases (6) and Notch (7), whereas the GLS2 gene was identified as a target of p53 tumor suppressor (8).
In GBM tissues GLS isoforms are highly expressed, while expression of GLS2 is silenced (11) via DNA hypermethylation (12). Recent findings indicate that isoforms arising from GLS play opposing roles to isoforms encoded by GLS2 in growth of GBM cells (13, 14). Stable transfection of human glioblastoma cell line T98G with a sequence encoding GAB leads to suppression of malignant phenotype of these cells by decreasing their proliferation, viability and ability to migrate (15). Moreover, the transfected cells, herein termed TGAB, are more sensitive to the alkylating agents used in glioma therapy (16). The exact mechanism of action of GAB remains unknown. Its nuclear localization in defined populations of neurons (17) and astrocytes (18) led to hypothesis that this molecule can modulate gene expression. Consistent with this hypothesis, microarray analysis revealed that transfection of T98G cells with GAB sequence deregulated expression of 85 genes (15).
GATA3 is one of the genes whose expression is upregulated in TGAB cells as compared to the controls (15). This gene codes for a multifunctional transcription factor which plays an important role in the development of several tissues including brain (19).
Available data on the role of GATA3 in the progression and development of tumors of different tissue origin are ambiguous. The loss of GATA3 expression in breast cancer is linked to aggressive tumor development, metastatic capability and poor prognosis (20). The low level of GATA3 is related to the promotion of cell migration and invasion of bladder cancer cells (21). Knockdown of GATA3 downregulated suppressors (UGT1A, PTEN, p53, p21) and upregulated oncogenes (i.e. c-myc, cyclin D1, cyclin D3, cyclin E, FGFR3) in SVHUC immortalized normal urothelial cells (22). In renal cell carcinoma GATA3 is silenced via hypermethylation (23). Low frequency of GATA3 expression has been detected in adenocarcinomas of lung, colon, endometrium, ovary and prostate (24). All the above would indicate a tumor suppressing role of GATA3. On the other hand, common GATA3 presence in skin adnexal tumors, mesothelioma, salivary gland and pancreatic ductal carcinomas may not favor its tumor suppressing role (24). Furthermore, overexpression of GATA3 correlates with a poor outcome of neuroblastoma patients (25). Strong expression of GATA3 has also been documented in Hodgkin lymphoma (HL) and down-regulation of GATA3 in HL cell lines demonstrated its role in the regulation of IL-5, IL-13, STAT4 (26).
Previously performed microarray analysis revealed increased expression of GATA3 in TGAB cells as compared to the controls (15). This prompted the question whether the high GATA3 content in GAB-enriched cells is a coincidence or reflects the regulation of expression of GATA3 by GAB. We first attempted to verify this hypothesis by comparing the mRNA and protein level of GATA3 in T98G and TGAB cell lines. Subsequently, we asked the question whether and in what degree the finding obtained in a cell line is reflected in clinical glioblastomas which are composed of a heterogeneous population of cells. To this end we measured the levels of GATA3 mRNA and protein in GLS2-negative GBMs tissues and in non-tumorigenic brain tissues previously shown to be GLS2-positive (12).
MATERIALS AND METHODS
Cell lines and culture conditions
T98G human glioblastoma cell line (American Type Culture Collection), TGAB and TpcDNA cell lines were maintained in Minimum Essential Medium Eagle (Sigma-Aldrich, St. Louis, MO, USA) supplemented with 10% fetal bovine serum (Gibco, Thermo Fisher Scientific, Grand Island, NY, USA), 1% non-essential amino acids (Gibco), and 1% antibiotics (penicillin and streptomycin) (Gibco). Cultures were maintained at 37°C in a humidified atmosphere with 5% CO2. TGAB and TpcDNA cell lines were obtained by stable transfection of T98G cells with a full cDNA sequence coding for human GAB or empty pcDNA3 vector respectively (15). The culture medium for TpcDNA and TGAB cells was additionally supplemented with 0.5 mg/mL G418 (BioShop, Lab Empire, Rzeszow, PL). The expression of the GLS2 gene in all cell lines was monitored by RT-PCR as described previously (15). Experiments were performed on cells harvested 24 hours after seeding.
Biopsy material
The clinical material wasobteined from the Department of Neurosurgery and Pediatric Neurosurgery of the Medical University Lublin, Poland and from the Department of Neurology and Neurosurgery, Faculty of Medical Sciences, University of Warmia and Mazury, Olsztyn, Poland. Written informed consent was obtained from the patients and all procedures were carried out according to the local Ethics Committee approval. Nine cases of primary glioblastoma (WHO grade IV) were obtained at the time of surgery and immediately frozen. Patients’ age and gender are presented in Table 1. Histological examination of resected tissues was performed by a neuropathologist according to the World Health Organization criteria (27). The control group consisted of four non-tumorigenic brain tissues: two GBM adjacent tissues retrieved from the margin of the tumor and two other obtained by intracranial decompression for severe traumatic brain injury. The control tissues were identified by a neuropathologist as non-neoplastic.
Protein isolation and western blot analysis
Cells or tissues were lysed in ice-cold RIPA buffer with cocktails of sodium fluoride, protease and phosphatase inhibitors (Sigma-Aldrich). Lysates were centrifuged at 12,000 g for 10 min at 4°C, and the supernatants were collected. Proteins concentrations were determined by bicinchoninic acid Protein Assay Kit (Pierce, Rockford, IL, USA). Fifty µg of cells or tissue proteins were separated by 10% SDS-PAGE and then electrotransferred to nitrocellulose membranes. Membranes were blocked with 5% skim milk for 1 hour at room temperature, and incubated with a human-specific anti-GATA3 antibody (Abcam, Cambridge, MA) overnight at 4°C. After washing, membranes were incubated with anti-rabbit antibody (Sigma-Aldrich) conjugated to horseradish peroxidase for 1 h at room temperature. Blots were visualized on X-ray film using a SuperSignal West Pico Chemiluminiscence Substrate (Pierce). For loading control, membranes were stripped for 15 min two times in Stripping Buffer and reused with an antibody against glyceraldehyde 3-phosphate dehydrogenase (ProteinTech, Chicago, IL, USA). Densitometric analysis was performed with G:Box system and GeneTools software (Syngene, Frederick, MD, USA).
Real-time PCR
Total RNA from cell lines and tissues were extracted using a commercially available TRI-Reagent (Sigma-Aldrich). Two µg of RNA were reverse-transcribed using High Capacity cDNA Reverse Transcription Kit (Applied Biosystems, Warrington, UK) according to the manufacturer’s protocol. The GATA3 primers were purchased from Applied Biosystems (assay ID: Hs00231122_m1), β-actin primers were purchased from Applied Biosystems (in case of cell line experiments, assay ID: 4326315E) and Blirt (Gdansk, PL) (in case of biopsy material experiments, cat no HK-DD-hu). Each reaction (total volume of reaction 10 µl) contained 5 µl TaqMan Universal PCR Master Mix (Applied Biosystems), 1 µl cDNA, 0.5 µl primers and RNAse/DNAse free water. The real time PCR reactions were performed at 95°C for 10 min, followed by 40 cycles of 30 s at 95°C and 1 min at 60°C. The results of the analysis were calculated by normalizing to the β-actin product. Results were expressed by an equation (2–ΔΔCt) that gives the amount of target, normalized to an endogenous reference and relative to a calibrator.
Statistical analysis
Statistical analysis was performed using GraphPad Prism 5 (GraphPad Software, La Jolla, CA, USA). Statistical significance was determined by one-way analysis of variance (one-way ANOVA) followed by Tukey’s test or by t-Test followed by Mann Whitney’s test. P < 0.05 was considered statistically significant.
RESULTS
Expression of GATA3 in glioblastoma cell lines
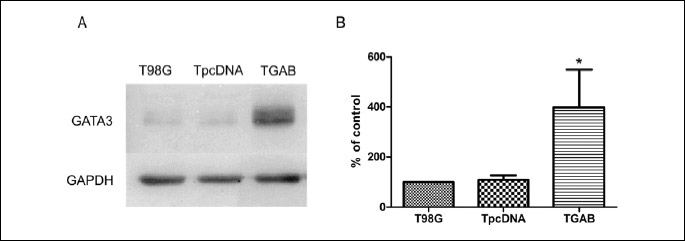
Previously performed microarray analysis revealed GATA3 as one of the 50 genes upregulated in TGAB cells as compared to both control T98G and TpcDNA cells (15). Here we validated this finding by real-time PCR analysis which showed 12 times higher level of GATA3 mRNA in TGAB cells compared to the controls (Fig. 1). Then we examined the level of GATA3 protein in all three cell lines. Densitometric analysis of band intensity revealed a 400% increase in the expression of GATA3 protein in TGAB cells as compared to the controls (Fig. 2).
 |
Fig. 1. Expression of mRNAs coding for GATA3 in T98G, TpcDNA and TGAB cell lines assessed by real-time PCR. Results are mean ± S.D. (n = 3 – 4). *P < 0.05 versus T98G and TpcDNA tested with the one-way ANOVA followed by Tukey’s test. |
Expression of GATA3 in glioblastoma clinical samples
The observation that GATA3 expression is evoked by overexpression of GLS2 in glioblastoma cells prompted us to examine GATA3 level in the clinical material. We used 5 GBM samples in which we have not detected GLS2 transcript and 2 non-tumorigenic brain tissues previously identified as expressing considerable amounts of GLS2 (12). More recently we extended our analysis to 4 additional GBM tissues in which we observed lack or extremely low amounts of GLS2 transcript and two non-tumorigenic brain tissues identified as GLS2-positive (data not shown). Real-time PCR analysis revealed a relatively similar level of GATA3 transcript in all 4 control samples examined, with 2–ΔΔCt values ranging from 0.6 to 1.5 (Fig. 3A). By contrast, a large variability in the expression level of this transcript was observed between GBM samples: 2–ΔΔCt values were ranging from 0.0 to 169.0 (Fig. 3A). The difference in GATA3 mRNA level between GBM and control tissues was statistically significant (P < 0.05) (Fig. 3B).
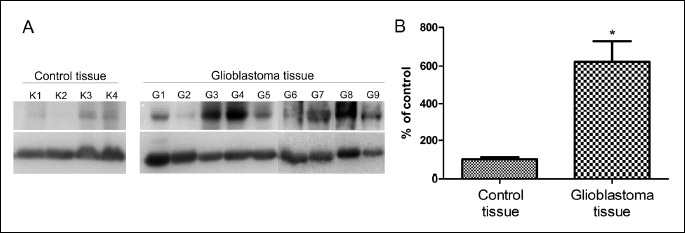
We further examined the level of GATA3 protein in the same clinical samples. We found GATA3 band in all GBM samples examined, although its intensity was heterogeneous (Fig. 4A). A faint signal was observed in one sample, a moderate in six samples and very sharp in two. A lack or trace of GATA3 band was observed in two control tissues, and a weak signal was found in another two (Fig. 4A). Altogether, statistical analysis showed significantly higher levels of GATA3 protein in GBM as compared to the controls (Fig. 4B).
DISCUSSION
A growing body of evidence indicates that particular GA isoforms play opposing roles in tumorigenesis. GLS proteins are generally perceived as molecules driving cancer cell metabolism by degrading Gln. The idea that the role of GLS2 proteins in tumorigenesis may be more complex was derived from the surprising finding that they are located not only in mitochondria, but also in the cell nuclei and as such may contribute to transcription modulation (17, 18).
Our previous study revealed abundance of GLS and lack of GLS2 expression in GBM tissues (11). Transfection of T98G glioblastoma cells with a sequence encoding GAB, the longer transcript arising from GLS2, decreased cell proliferation and their ability to migrate (15). The mechanisms underlying the mode of action of GAB in glioblastoma cells remains to be elucidated. T98G cells transfected with GAB sequence, termed TGAB, presented deregulated expression of many genes, of which some could be potentially related to oncogenesis (15). One of the downregulated genes codes for a DNA-repair protein, O6-methylguanine DNA methyltransferase (MGMT) that is associated with resistance to therapies using alkylating agents. Our later study showed that TGAB cells are more sensitive to these compounds as compared to the controls (16).
According to the microarray analysis, GATA3 was another gene deregulated in TGAB cells (15). As outlined in the Introduction, GATA3 is assumed to play important, albeit variable roles in progression of tumors in different tissues (20-26). Herein, we confirmed a marked increase in both GATA3 mRNA and protein in TGAB cells as compared to the controls. However, the results obtained with human GBM samples and non-tumorigenic brain tissue do not support positive correlation between the expression of the two proteins and as such cast doubt on their interaction in determining the tumor phenotype. Out of the nine GBM samples, all of which were GLS2-deficient (12), six showed clear GATA3 upregulation as compared to the non-tumorigenic samples, three of them presented relatively lower GATA3 level. Non-tumorigenic samples, all of which presented abundant GLS2 expression, had none to low GATA3 levels. Altogether, GATA3 expression in GBM samples exceeded that in non-tumorigenic samples over 6 times, a value comparable to the GLS2-driven enrichment of GATA3 in a GBM cell line. These results suggest that mechanistic relation, if any, between GAB and GATA3 expression appears to be a result of in vitro manipulation carried out in this particular GBM cell line, but is not an intrinsic reproducible property of GBM tissue. The above suggestion is consistent with an increasing body of evidence indicating that biological features of glioblastoma cell lines do not genuinely reflect those of tumors grown in vivo (28) and that the metabolic incompatibility of cell lines with cells from which they directly originate goes down to the DNA profile (29).
Going back to the GLS2/GATA3 interrelations, the analysis of data generated by the TCGA (The Cancer Genome Atlas) Research Network (http://cancergenome.nih.gov) did not reveal a survival benefit related to high GLS2 or GATA3 expression in native tumors. Moreover, examination of the PathCards database (https://pathcards.genecards.org) appears to indicate that GLS2 and GATA3 pathways are not very likely to be interdependent (30). Clearly, the above considerations do not exclude some indirect mutual control of their expression: lack of success in finding the interdependence may in part reflect differences in the cellular composition of the examined material: cellular homogeneity of the cell line versus molecular and cellular heterogeneity of GBM tissues, which is their hallmark (1). In the future experiments the GATA3/GLS2 relationship will have to be analyzed by measuring the effects of in situ manipulations with GATA3 expression in cell lines and GBM-derived native cell cultures. Such experiments are under way in this laboratory. On the other hand, the variability in GATA3 protein level among GBMs observed in this study can result from the activation of different responses in GBM tissues with different genomic profiles, per se reflecting their heterogeneity. Of note, a great divergence in GATA3 protein level was documented in GBM tissues carrying a wild-type PTEN, while a decreased amount of GATA3 protein was found in GBM samples having PTEN nonsense mutations (31).
In summary, we documented a transcriptional regulation of GATA3 in glioblastoma cells upon transfection with GAB sequence. On the other hand, we have also shown considerable, though variable GATA3 level in GBM clinical samples not expressing GLS2. The tumor-promoting effect of the absence of GLS2 noted in the GBM cell line is likely to hold for GBM tissue. However, the ubiquity of this relation remains to be proven, as reports regarding the role of GLS2 in peripheral tumors are conflicting; in hepatocellular carcinoma this isoform has been claimed to either promote (32) or inhibit (33) growth and invasion of cancer cells. Moreover, downstream mechanisms disclosed in the cell line may not reflect that operating in GBM tissue. It remains to be elucidated whether and how overexpression of GATA3 affects the progression of GBM in the clinical setting.
Acknowledgments: The authors are greatly indebted to the teams of the regional pathology units (the Laboratory of Neuropathology, Department of Neurosurgery and Paediatric Neurosurgery, Medical University of Lublin, Poland and the Department of Pathomorphology, Faculty of Medical Sciences, University of Warmia and Mazury, Olsztyn, Poland) for providing histopathological services.
The study was supported by the Leading National Research Centre (KNOW-MMRC) project (EM).
Conflict of interests: None declared.
REFERENCES
- Aldape K, Zadeh G, Mansouri S, Reifenberger G, von Deimling A. Glioblastoma: pathology, molecular mechanisms and markers. Acta Neuropathol 2015; 129: 829-848.
- Hensley CT, Wasti AT, DeBerardinis RJ. Glutamine and cancer: cell biology, physiology, and clinical opportunities. J Clin Invest 2013; 123: 3678-3684.
- Campos-Sandoval JA, Martin-Rufian M, Cardona C, Lobo C, Penalver A, Marquez J. Glutaminases in brain: multiple isoforms for many purposes. Neurochem Int 2015; 88: 1-5.
- Perez-Gomez C, Campos-Sandoval JA, Alonso FJ, et al. Co-expression of glutaminase K and L isoenzymes in human tumour cells. Biochem J 2005; 386: 535-542.
- Lobo C, Ruiz-Bellido MA, Aledo JC, Marquez J, Nunez De Castro I, Alonso FJ. Inhibition of glutaminase expression by antisense mRNA decreases growth and tumourigenicity of tumour cells. Biochem J 2000; 348: 257-261.
- Wang JB, Erickson JW, Fuji R, et al. Targeting mitochondrial glutaminase activity inhibits oncogenic transformation. Cancer Cell 2010; 18: 207-219.
- Kalhert UD, Cheng M, Koch K, et al. Alterations in cellular metabolome after pharmacological inhibition of Notch in glioblastoma cells. Int J Cancer 2016; 138: 1246-1255.
- Hu W, Zhang C, Wu R, Sun Y, Levine A, Feng Z. Glutaminase 2, a novel p53 target gene regulating energy metabolism and antioxidant function. Proc Natl Acad Sci USA 2010; 107: 7455-7460.
- Liu J, Zhang C, Lin M, et al. Glutaminase 2 negatively regulates the PI3K/AKT signaling and shows tumor suppression activity in human hepatocellular carcinoma. Oncotarget 2014; 5: 2635-2647.
- Gao P, Tchernyshyov I, Chang TC, et al. c-Myc suppression of miR-23a/b enhances mitochondrial glutaminase expression and glutamine metabolism. Nature 2009; 458: 762-765.
- Szeliga M, Sidoryk M, Matyja E, Kowalczyk P, Albrecht J. Lack of expression of the liver-type glutaminase (LGA) mRNA in human malignant gliomas. Neurosci Lett 2005; 374: 171-173.
- Szeliga M, Bogacinska-Karas M, Kuzmicz K, Rola R, Albrecht J. Downregulation of GLS2 in glioblastoma cells is related to DNA hypermethylation but not to the p53 status. Mol Carcinog 2016; 55: 1309-1316.
- Szeliga M, Bogacinska-Karas M, Rozycka A, Hilgier W, Marquez J, Albrecht J. Silencing of GLS and overexpression of GLS2 genes cooperate in decreasing the proliferation and viability of glioblastoma cells. Tumour Biol 2014; 35: 1855-1862.
- Martin-Rufian M, Nascimento-Gomes R, Higuero A, et al. Both GLS silencing and GLS2 overexpression synergize with oxidative stress against proliferation of glioma cells. J Mol Med (Berl) 2014; 92: 277-290.
- Szeliga M, Obara-Michlewska M, Matyja E, et al. Transfection with liver-type glutaminase cDNA alters gene expression and reduces survival, migration and proliferation of T98G glioma cells. Glia 2009; 57: 1014-1023.
- Szeliga M, Zgrzywa A, Obara-Michlewska M, Albrecht J. Transfection of a human glioblastoma cell line with liver-type glutaminase (LGA) down-regulates the expression of DNA-repair gene MGMT and sensitizes the cells to alkylating agents. J Neurochem 2012; 123: 428-436.
- Olalla L, Gutierrez A, Campos JA, et al. Nuclear localization of L-type glutaminase in mammalian brain. J Biol Chem 2002; 277: 38939-38944.
- Cardona C, Sanchez-Mejias E, Davila JC, et al. Expression of Gls and Gls2 glutaminase isoforms in astrocytes. Glia 2015; 63: 365-382.
- Tsarovina K, Reiff T, Stubbusch J, et al. The Gata3 transcription factor is required for the survival of embryonic and adult sympathetic neurons. J Neurosci 2010; 30: 10833-10843.
- Yoon NK, Maresh EL, Shen D, et al. Higher levels of GATA3 predict better survival in women with breast cancer. Hum Pathol 2010; 41: 1794-1801.
- Li Y, Ishiguro H, Kawahara T, Kashiwagi E, Izumi K, Miyamoto H. Loss of GATA3 in bladder cancer promotes cell migration and invasion. Cancer Biol Ther 2014; 15: 428-435.
- Li Y, Ishiguro H, Kawahara T, Miyamoto Y, Izumi K, Miyamoto H. GATA3 in the urinary bladder: suppression of neoplastic transformation and down-regulation by androgens. Am J Cancer Res 2014; 4: 461-473.
- Cooper SJ, Zou H, Legrand SN, et al. Loss of type III transforming growth factor-beta receptor expression is due to methylation silencing of the transcription factor GATA3 in renal cell carcinoma. Oncogene 2010; 29: 2905-2915.
- Miettinen M, McCue PA, Sarlomo-Rikala M, et al. GATA3: a multispecific but potentially useful marker in surgical pathology: a systematic analysis of 2500 epithelial and nonepithelial tumors. Am J Surg Pathol 2014; 38: 13-22.
- Peng H, Ke XX, Hu R, Yang L, Cui H, Wei Y. Essential role of GATA3 in regulation of differentiation and cell proliferation in SK-N-SH neuroblastoma cells. Mol Med Rep 2015; 11: 881-886.
- Stanelle J, Doring C, Hansmann ML, Kuppers R. Mechanisms of aberrant GATA3 expression in classical Hodgkin lymphoma and its consequences for the cytokine profile of Hodgkin and Reed/Sternberg cells. Blood 2010; 116: 4202-4211.
- Louis DN, Ohgaki H, Wiestler OD, et al. The 2007 WHO classification of tumours of the central nervous system. Acta Neuropathol 2007; 114: 97-109.
- Grabacka M, Waligorski P, Zapata A, et al. Fenofibrate subcellular distribution as a rationale for the intracranial delivery through biodegradable carrier. J Physiol Pharmacol 2015; 66: 233-247.
- Allen M, Bjerke M, Edlund H, Nelander S, Westermark B. Origin of the U87MG glioma cell line: good news and bad news. Sci Transl Med 2016; 8: 354re3. doi: 10.1126/scitranslmed.aaf6853
- Belinky F, Nativ N, Stelzer G, et al. PathCards: multi-source consolidation of human biological pathways. Database (Oxford) 2015; pii: bav006. doi: 10.1093/database/bav006
- Xu J, Li Z, Wang J, Chen H, Fang JY. Combined PTEN mutation and protein expression associate with overall and disease-free survival of glioblastoma patients. Transl Oncol 2014; 7: 196-205.
- Lee YZ, Yang CW, Chang HY, et al. Discovery of selective inhibitors of glutaminase-2, which inhibit mTORC1, activate autophagy and inhibit proliferation in cancer cells. Oncotarget 2014; 5: 6087-6101.
- Kuo TC, Chen CK, Hua KT, et al. Glutaminase 2 stabilizes Dicer to repress Snail and metastasis in hepatocellular carcinoma cells. Cancer Lett 2016; 383: 282-294.
A c c e p t e d : April 15, 2017