ASSESSMENT OF NEUROTOXICITY OF PHARMACOLOGICAL COMPOUNDS DURING EARLY NEURAL DEVELOPMENT OF HUMAN EMBRYONIC STEM CELLS
INTRODUCTION
Exposure to neurotoxic chemicals during neural development can produce a wide range of potential and adverse effects on brain development and subsequent maturation, such as functional impairment or disease at any point within the human lifespan, from before birth to very old age. Developmental neurotoxicity testing using laboratory animals is expensive, time-consuming, and often does not recapitulate many aspects of human physiology (1). Therefore, it is necessary to develop alternatives to animal testing protocols and guidelines currently used to evaluate such toxicity. The first goal of generating alternatives is to develop more efficient testing methods; in particular, methods that can assess the hazards associated with the large number of currently untested chemicals that are commercially available (2). Furthermore, the accumulation of such hazard information will be useful when evaluating and comparing the predictive capacity and efficiency of newly developed chemicals. The second goal is to reduce the use of animals in toxicity testing based on the replacement, reduction, and refinement (3R) approach to animal testing (3).
Human embryonic stem cells (hESCs), which are derived from pre-implantation embryos, retain the developmental potency for differentiation into cells and tissues of all three germ layers (4) and the capacity for indefinite self-renewal through an in vitro system. Through these features, hESCs can differentiate into functional neurons and glia through a mechanism similar to that in human brain development, when given the appropriate cellular components (5). The embryonic stem cell test (EST), which uses mouse ESCs, is an alternative test for assessing developmental toxicity that has attracted much attention, but it has interspecies differences when applied in humans. Many toxicologists have focused on the development of in vitro systems using hESCs to overcome species-specific differences such as those related to genetic factors, DNA methylation, and DNA repair processes (6). In vitro hESC models can reflect human physiology and have the potential to provide a cost-effective approach to improving the assessment and prediction of toxicity following exposure to chemical compounds including drugs, food additives, cosmetics, pesticides, and industrial chemicals during the early developmental period. Therefore, many research groups have investigated developmental toxicity tests that use hESCs (7-9).
Since cellular diversity in the mature central nervous system (CNS) implies a large diversity in precursor cell populations, proper neural differentiation is produced through successive stem/progenitor stages or populations that are present during different stages of the neural cell cycle and that show different cellular characteristics, developmental capability, and flexibility (10). Neurogenesis, consisting of proliferation, differentiation, and survival, is regulated by a network of factors. Differentiated neurons aged 2 – 3 weeks can begin to receive excitatory input from cortical perforant path axons, and they have similar physiology and anatomy to that of mature neurons by the age of 4 – 8 weeks (11). Gamma-aminobutyric acid (GABA) acting as the primary inhibitory neurotransmitter in the brain induces cell differentiation and survival, but suppresses proliferation. Glutamate acting as the primary excitatory neurotransmitter is also an essential factor for proper cell survival. Other modulatory neurotransmitters including serotonin and acetylcholine have been implicated in numerous mental health conditions and are necessary for cell proliferation, proper maturation, and survival (11).
In this study, we evaluated the toxicity of three chemotherapy agents (cytosine arabinoside, 5-fluorouracil, and hydroxyurea), two anti-inflammatory agents (indomethacin, dexamethasone), and a negative toxicant (ascorbic acid) by examining cell viability and expression of various neural markers in the early stages of neural differentiation of hESCs, as well, we identified biomarkers suitable for assessing neurotoxicity. Developmental toxicity of compounds is related to structural or functional alterations that interfere with homeostasis, differentiation, and development. Cytosine arabinoside, used in treatment of hematological malignancies (12), acts as a specific competitive inhibitor of DNA polymerases and competes with deoxycytidine triphosphate (13). Although 5-fluorouracil was identified as a teratogen in mouse (14), it has been used as a chemotherapy agent against cancer through it capacity to block thymidine synthesis (15). Hydroxyurea is an antineoplastic agent for myelocytic leukemia (16) and ovarian cancer (17) that acts via inhibition of ribonucleotide reductase that is involved in DNA synthesis (18). Indomethacin, which suppresses the synthesis of prostaglandins, is widely used as a prescription medication for reduction of fever, pain, stiffness, and swelling (19). Dexamethasone, as an anti-inflammatory and anti-autoimmune agent, has been shown to be embryotoxic as it inhibits development of the embryo via its interference in DNA synthesis (20). The effects of the aforementioned six pharmacological compounds in differentiation-related genes were investigated in hESCs differentiating into neural cells.
MATERIALS AND METHODS
Ethics statement
This study using mouse embryonic fibroblasts (mEFs; CBNUA-946-16-01) and human embryonic stem cells (hESCs; CBNU-IRB-2012-1-1) was approved by the Ethics Committee of Chungbuk National University.
Chemicals
Cytosine arabinoside (C6645), hydroxyurea (8627) and ascorbic acid (A7631) were diluted in D-PBS to a concentration of 10–1M and stored in aliquots at –20°C. 5-fluorouracil (F6627), indomethacin and dexamethasone (D4902) were diluted in DMSO (D2438) to a concentration of 10–1M and stored in aliquots at –4 or –20°C. All chemicals were purchased from Sigma-Aldrich (St. Louis, MO, USA).
Cell culture
H9 hESCs (WiCell, Madison, WI, USA) were cultured on mouse embryonic fibroblasts (mEFs) according to our laboratory protocol (21).
Neural differentiation and harvest
For formation of human embryoid bodies (EBs), a cell solution containing 2.0 × 10⁵ hESCs/mL in culture medium was prepared with/without pharmacological compounds. Ninety drops with 20 µL of cell suspension per drop were plated on the lid of a 90 mm Petri dish (SPL, Pocheon, South Korea) and cultured as hanging drops for 4 days after turning over the lids. The culture medium consisted of DMEM/F12 (Invitrogen, Carlsbad, CA, USA) supplemented with 20% defined fetal bovine serum (FBS) (Thermo Scientific HyClone, Logan, UT, USA), 1% nonessential amino acids (Invitrogen), 0.1 mM β-mercaptoethanol (Invitrogen), 2 mM L-glutamine (Invitrogen), and 50 U/mL penicillin/streptomycin (Invitrogen). D-PBS (7 mL) was added to the bottom of the Petri dish to protect the drops from drying. After hanging the drops for 4 days, the EBs were transferred to a non-coated Petri dish-plate with the same culture medium and were incubated as a suspension for 3 days. Subsequently, eight EBs per well of a 6-well plate (Invitrogen) were attached and differentiated in 2 mL of neural differentiation medium (Neurocult, Stemcell Technologies, Vancouver, BC, Canada) with/without pharmacological compounds for 21 days (Fig. 1A). Neural differentiation medium was replaced every three or four days. Five of the six tested compounds (5-fluorouracil, hydroxyurea, indomethacin, dexamethasone, and ascorbic acid) were treated at 10–8, 10–6, and 10–4M in culture/neural differentiation medium, while cytosine arabinoside was treated at 10–10, 10–8 and 10–6M. To compare the expression levels of neuronal progenitor and neural-specific markers, hESCs were harvested every week over a period of 28 days (Fig. 1A). First, hESCs were evaluated at the EB state that was formated for 7 days (EB formation step). Those EBs were then allowed to differentiate for 21 days (differentiation step), after which the differentiated cells were harvested at weekly intervals to assess neurogenesis.
Cytotoxicity assay
A cell suspension (50 µL) containing 1.0 × 10⁵ hESCs/mL were allowed to adhere for 2 hours onto gelatin-coated 96-well plates at 5000 hESCs/well. Neural differentiation medium (150 µL) with/without 1.333 times the final concentration of pharmacological compounds was added to each well and the hESCs were grown for 10 days. At the end of the treatment period, the cells were incubated with Cell Counting Kit-8 solution (Dojindo Laboratories, Tokyo, Japan) in the dark for 2 hours. The absorbance of each well was measured at 450 nm by using an Epoch Microplate Spectrophotometer (BioTek Instruments, Winooski, VT, USA). The percentage of cell viability was determined from the absorbance of each well relative to the absorbance of the vehicle control cells, which was set at 100%. D-PBS was used as a vehicle control for cytosine arabinoside, hydroxyurea and ascorbic acid, and DMSO was a vehicle control for 5-fluorouracil, indomethacin and dexamethasone. The IC50 values were calculated according to the concentration-response curve by GraphPad Prism 6.01 (GraphPad Prism Software, San Diego, CA, USA). The final concentration of six compounds ranged from 10–11 to 10–3 M.
Real-time PCR
Total RNA was isolated by using TRI reagent (Invitrogen) according to the manufacturer’s protocol. Total RNA (1 µg) was reverse transcribed into first-strand cDNA by using Moloney murine leukemia virus reverse transcriptase (Invitrogen) and random primers (9-mers; TaKaRa Bio., Otsu, Japan). Quantitative real-time PCR was performed in a 20 µL mixture of 10 µL of 2 × SYBR Premix Ex Taq (TaKaRa Bio.), 0.4 µL Rox dye (TaKaRa Bio.), 0.4 µL each of forward and reverse primers (Table 1), and 8.2 µL RNase-free water by using an Applied Biosystems 7300 real-time PCR system. Fluorescence intensity was measured at the end of the extension phase of each cycle. The PCR cycle at which the fluorescence intensity threshold was in the exponential phase of PCR amplification was designated as the threshold cycle (CT). The amount of transcripts was quantified relative to that of the internal control gene (GAPDH) based on the comparison of CTs at constant fluorescence intensity. The transcript amount was inversely related to the observed CT, and the CT was expected to increase by 1 for every two-fold dilution of the transcript. Relative expression (R) was calculated using the equation R = 2–[ΔCT target gene – ΔCT internal control]. All data were normalized relative to GAPDH as well as to the respective controls.
Immunocytochemistry
The EBs formed after 7 days were cultured and differentiated in 4-well plates (Invitrogen) for 14 days in neural differentiation medium. For the staining procedure, the cells were fixed with 4% paraformaldehyde in PBS for 20 min at room temperature (RT) and then washed twice for 5 min with TBST (20 mM Tris-HCl (pH 7.4), 0.15 M NaCl, and 0.05% Tween-20). Fixed cells were permeabilized by 0.1% Triton X-100 (Sigma-Aldrich) in PBS for 10 min at RT and washed twice for 5 min with TBST. Afterward, the cells were incubated for 30 min in blocking solution (4% normal goat serum in PBS) at RT. The primary antibody against nestin (sc-23927; Santa Cruz, Dallas, TX, USA) and was diluted 1:200 in the blocking solution. After incubating with the primary antibodies for 1 hour at RT, the cells were washed three times for 5 min with TBST and then incubated with Alexa 488-labeled goat anti-mouse IgG (1:1000, #35502; Invitrogen) for 30 min at RT. The cells were then washed three times for 5 min with TBST and incubated with 4’, 6-diamidino-2-phenylindole dihydrochloride (DAPI, 100 ng/ml) for 20 min at 37°C in the dark to stain the nuclei. Images of cells were taken under the same exposure conditions by using a fluorescence microscope (IX71; Olympus, Tokyo, Japan). The fluorescence area was analyzed by NIH image J software under the same hue, saturation, and brightness conditions.
Representation and statistical analysis of data
The transcriptional level of a gene in a compound treatment group was expressed as a relative level to that of a gene in the non-treatment group (represented by 1) and shown in an equilateral triangle as a thick line. The length from the center of the equilateral triangle to the vertex represents a dose of compound and indicates the relative level of transcripts in the compound treatment group. Bias in the direction of the triangle shows the responsiveness to the compound dose of a specific gene. The area of the triangle was determined by the equation: Area = (Öľ) × a × b + b ×c + c × a where a, b, and c refer to the relative expression level of a gene in low, middle, and high treatment doses, respectively.
All experiments were performed three times in triplicate. Data are presented as the mean ± S.D. and were analyzed using two-way analysis of variance (ANOVA). Statistical analyses were performed by using GraphPad Prism 6.01. P-values < 0.05 were considered statistically significant.
RESULTS
Expression level of neuronal markers during neural differentiation
Transcriptional levels of neural-specific markers such as dopaminergic neuron (NR4A2), GABAergic neuron (SLC32A1 and GAD1), glutamatergic neuron (SLC1A2 and SLC17A6), and oligodendrocytes (CNP and OLIG2), as well as neural progenitor markers (FABP, FOXG1, NES and TUBB3) were evaluated as mRNA levels (Fig. 1). At 14 days after differentiation (Diff. 14d), the mRNA level of NES (CNS progenitor cell marker) had increased. The transcriptional levels of GAD1, SLC17A6 and CNP were highest at 21 days after differentiation (Diff. 21d), and TUBB3, a microtubule element found almost exclusively in neurons, had the highest expression at Diff. 21d. Since the highest levels of most neural markers were observed at Diff. 21d, we decided to evaluate the neurotoxicity of each of the six compounds at that time.
Cytotoxic effects of pharmacological compounds
We measured cytotoxicity by exposing hESCs to six compounds (cytosine arabinoside, 5-fluorouracil, hydroxyurea, indomethacin, dexamethasone, and ascorbic acid) in neural differentiation media for 10 days. The cell viability results showed a dose-dependent decrease in viability (Fig. 2). Based on the obtained curves, IC50 values for compounds were calculated (Table 2). Following hESC exposure to the compounds for 10 days, the IC50 values were 0.6135 µM for cytosine arabinoside, 0.06879 µM for 5-fluorouracil, 1.606 µM for hydroxyurea, 1325 µM for dexamethasone, and 282 µM for indomethacin. Ascorbic acid, which was the negative control, had the highest IC50 values (3444 µM) among the tested chemicals at concentrations of 10–11M to 10–3M. Cytosine arabinoside, 5-fluorouracil, and hydroxyurea had notably low IC50 values, indicating strong cytotoxicity. Indomethacin and dexamethasone showed a relatively high IC50 indicating weak cytotoxicity.
Effect of pharmacological compounds on specific neuronal markers
To assess the neurotoxicity of the six pharmacological compounds, hESCs were grown in hanging drops with test compounds for 21 days until differentiation. The effect of the six compounds on expression of neuronal markers was evaluated by quantitative real-time PCR under the same concentration conditions (10–8, 10–6 and 10–4M), except for cytosine arabinoside (10–10, 10–8 and 10–6M) at Diff. 21d. Since NR4A2 and SLC32A1 were highly expressed in the EB state (Fig. 1B), the mRNA levels of these genes were measured at EB 7d and Diff. 21d. Triangular charts were used to easily identify the transcriptional levels and expression tendencies of neural markers under three different compound concentrations (Fig. 3 and Table 3). The value at the top right of Fig. 3 represents the dark gray triangle area of the compound treated group versus the triangle area with the thick line of the non-treatment group. These values easily indicate increase or decrease by compounds in expression of neural markers. The expression of NR4A2 was significantly increased by 5-fluorouracil, indomethacin, and ascorbic acids at EB 7d and by hydroxyurea at Diff. 21d. SLC321 mRNA at EB 7d showed a high level in low doses of six compounds. Transcriptional levels of GAD1 and FOXG1 decreased in all compounds tested. The expression of glutamatergic neuron markers including SLC1A2 and SLC17A6 was strongly inhibited by cytosine arabinoside and hydroxyurea. In hESCs treated with 5-fluorouracil, dexamethasone or indomethacin, contrary patterns showing increases and decreases for SLC1A2 and SLC17A6 were observed. At Diff. 21d, transcriptional levels of CNP, FABP, NES and TUBB3 were significantly decreased by all of the tested pharmacological compounds except ascorbic acid. The relative levels of OLIG2 transcripts were cytosine arabinoside > 5-fluorouracil > hydroxyurea > indomethacin > dexamethasone, which was similar to the level of cytotoxicity of those compounds, as shown in Fig. 2. These results suggest that the reduction of neural markers such as GAD1, CNP, OLIG2, FABP, FOXG1, NES and TUBB3 in compound-treated groups compared to the control and ascorbic acid-treated group are useful biomarkers for assessment of the neurotoxicity of pharmacological compounds.
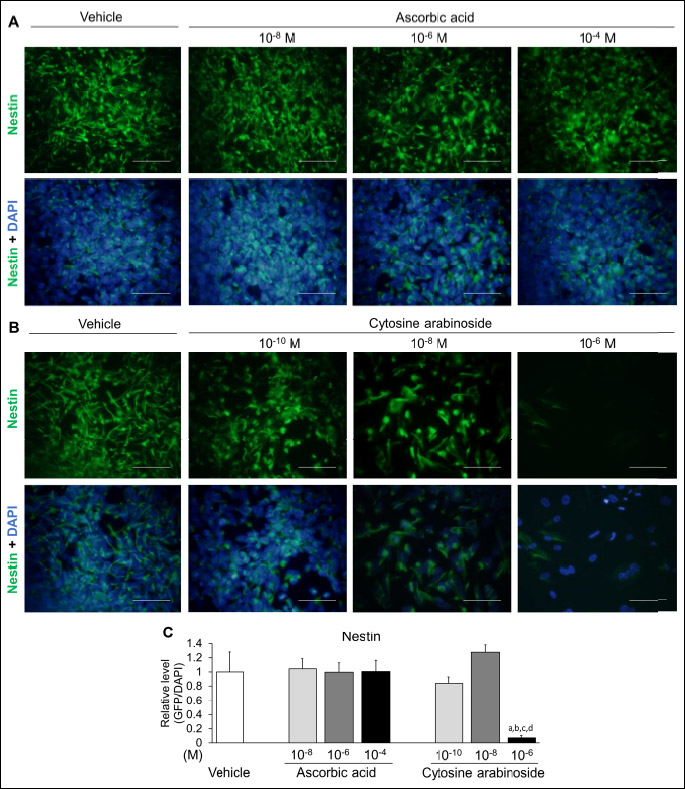
Expression of nestin proteins in immunofluorescence assays
To confirm the neural toxic effect of pharmacological compound on neural marker protein, hESCs at Diff. 14d were evaluated by using immunofluorescence assays. Since transcriptional level of NES decreased in a dose-dependent manner, the expression of nestin protein was examined in differentiated hESCs (Fig. 4). Human nestin probed with green fluorescence was expressed in both the ascorbic acid and cytosine arabinoside-treated groups. Immunoreactive nestin at all doses of ascorbic acid (10–8, 10–6 and 10–4M) was expressed similarly to the vehicle, while nestin significantly decreased in response to the high dose of cytosine arabinoside (10–6M) compared to the vehicle and all doses of ascorbic acid. Thus, nestin is a reliable and useful marker with the potential to evaluate the neurotoxicity of pharmacological compounds during embryonic development.
DISCUSSION
Human neural development requires highly coordinated cellular interactions among functionally distinct cell types including neurons, glia, blood vessels, and microglia (22). These interactive features make it difficult to develop in vitro neurotoxicity tests. However, since dysfunction of neuronal markers by chemicals during early neural differentiation can result in adverse effects on subsequent neural development, our attention has focused on early neural differentiation of hESCs.
For assessing toxicity during early neural differentiation, the cytotoxicities of six well-known chemicals were measured by performing CCK assays. Cytosine arabinoside, 5-fluorouracil, and hydroxyurea exhibited strong toxicity, while indomethacin and dexamethasone showed relatively weaker toxicity in hESCs. Next, hESCs in medium for neural differentiation underwent early neural differentiation through the EB state for 21 days. These events were confirmed by the expression of several neural markers, while the neurotoxicity of six chemicals was assessed by reduction in expression of those markers. With the exception of ascorbic acid, acting as a negative control, the transcripts of GAD1, CNP, FABP, NES, and TUBB3 were downregulated by the neurotoxic effects of the other five pharmacological compounds. Moreover, the transcription of OLIG2 was reduced to a similar level to cytotoxic level by six pharmacological compounds. Cytotoxicity and inhibition of neural differentiation by the compounds are similar but not completely consistent. For example, cytosine arabinoside, 5-fluorouracil and hydroxyl urea are classified as strong developmental toxicants in many in vivo and in vitro studies. In the triangle area, these compounds dramatically reduced the expression of various neural marker genes during neural differentiation. 5-Fluorouracil showed strong cytotoxicity in the CCK assay, but it had a weaker inhibitory effect on neural differentiation than cytosine arabinoside and hydroxyurea.
In a previous developmental toxicity study using animals, treatment with cytosine arabinoside resulted in impaired brain development of fetuses and offspring in pregnant rats (23), as well as a decrease in the number of fetuses and a reduction of total body weight of the fetus during pregnancy (24). In the present study, cytosine arabinoside showed significantly low values (less than 0.1) in the triangle area of all neural markers, except NES, at Diff. 21d. In many studies, 5-fluorouracil is used for treatment of malignant tumors through direct cytotoxicity, apoptosis and epithelial cell hypoproliferation (25), and has been defined as a developmental toxicant causing malformation and growth inhibition of the fetus during pregnancy (14, 15). As shown in Fig. 2, 5-fluorouracil produced the strongest cytotoxicity but had a relatively weak effect on the expression of neural markers when compared to cytosine arabinoside or hydroxyurea. Conversely, several clinical studies have reported that patients with dihydropyrimidine dehydrogenase deficiency, which is the rate-limiting enzyme in the catabolism of 5-fluorouracil, exhibited severe 5-fluorouracil-associated neurotoxicity (26-28). It has also been reported that hydroxyurea treatment resulted in significantly decreased fetal development via inhibition of DNA and protein synthesis (29), and that effect impaired dopaminergic modification (30). In the triangular chart of the hydroxyurea-treated group (Fig. 3), the length from the center of the equilateral triangle to the vertex, which represents the dose of the compound, exhibited a dose-dependent reduction in all tested neural markers, except NR4A2. Because NR4A2 controls maintenance of the dopaminergic neuron, its dysfunction can result in dopaminergic disorders including Parkinson’s disease, schizophrenia, and manic depression (30).
In a four-vessel occlusion rat model of cerebral ischemia/reperfusion, indomethacin significantly diminished the ischemia-evoked release of glutamate and aspartate, but not of GABA (31). Indomethacin during neural differentiation of hESCs increased the transcriptional level of SLC32A1, which is a GABAergic marker involved in uptake of inhibitory neurotransmitters, such as GABA and glycine, into synaptic vesicles at medium and high doses (10–6 and 10–4M). Moreover, indomethacin reduced the mRNA level of SLC17A6, which has a key role in the uptake of the excitatory neurotransmitter glutamate into synaptic vesicles (32), but increased expression level of SLC1A2, which acts as a transporter for elimination of glutamate from the extracellular space (33). Since proper glutamate clearance is necessary for preventing neural damage from excessive activation, dysfunction in SLC1A2 has been correlated with diseases such as brain injury and traumatic brain injury (34). Despite extensive use of dexamethasone, it has been associated with impaired differentiation of neuronal stem cells and reduced the length of neurites and the size of oligodendrocytes (35). The main function of oligodendrocytes is to insulate axons by creating a myelin sheath. CNPase is a myelin-related enzyme expressed exclusively by oligodendrocytes in the CNS. Dexamethasone dose-dependently reduced the level of CNP mRNA, indicating that oligodendrocyte differentiation was decreased and disturbed in dexamethasone-exposed hESCs. While ascorbic acid has been shown to diminish intracellular reactive oxygen levels, it does not influence the differentiation of neuronal progenitor cells (36). The IC50 values of ascorbic acid and dexamethasone, as assessed by hESCs in neural differentiation medium, were higher than those derived from culture of mouse ESCs in undifferentiation medium. These results suggest two possibilities; one is due to differing differentiating states, and the other is due to species differences.
Cytosine arabinoside, hydroxyurea, and dexamethasone suppressed the levels of SLC1A2 mRNA, which is a well-defined marker of astrocytes, suggesting that these compounds may impair development into astrocytes. The level of SLC17A6 mRNA was highest in response to high doses of 5-fluorouracil, dexamethasone, and indomethacin. Because excitotoxic events begin with vesicular release (37), increases in SLC17A6 transcripts in the presence of high levels of compounds indicates the occurrence of excitotoxicity. Excitotoxicity is a specific type of neurotoxicity in which nerve cells are damaged or killed by excessive stimulation by neurotransmitters such as glutamate and similar substances (38). Glutamate binds to a variety of excitatory amino acid receptors, such as NMDA and AMPA receptors, and activation of these receptors induces depolarization and neuronal excitation. Activation of excitatory amino acid receptors is normally a transitory event; however, if receptors are overactivated for any reason, or if their activity is prolonged by glutamatergic storms, the target neurons become damaged and eventually die (39). In our study, transcript of NES were reduced by all investigated compounds except ascorbic acid. Nestin protein showed reduced levels in viable and nestin-expressing cells in response to treatment with cytosine arabinoside, but a similar level to vehicle in ascorbic acid-treated cells. Nestin is an intermediate filament protein known as a neural stem/progenitor cell marker, and expression of immunoreactive human nestin in CNS cells during development has been reported (40). Beta3-tubulin is a microtubule element belonging to a class III member of the beta tubulin protein family that is primarily expressed in neurons (41).
Existing developmental neurotoxicity studies have focused on suggesting major biomarkers through toxicogenomics by DNA microarray and next generation sequencing methods after treatment of one or two drugs during the neurogenesis of hESCs (42, 43). However, these studies have limitations in that there are no definite endpoints or evaluation methods. In our results, we have suggested methods for assessing neurotoxicity via cytotoxicity and transcriptional levels using triangle area. Recently, the use of a microelectrode array (MEA) has been increasing to evaluate the activity and functionality of differentiated neurons from hESCs or human induced pluripotent stem cells (hiPSCs). Since MEA can measure the electrical excitable activity and network activity of neurons through simultaneous extracellular recordings from multiple sites (up to 64 electrodes) in real time, several papers have used MEA for neurotoxicity testing (44, 45).
Based on our hypothesis that impaired neural progenitor cells in early development cannot normally develop and differentiate, this study suggests several biomarkers (GAD1, CNP, OLIG2, FABP, NES, and TUBB3) useful for assessment of neurotoxicity during the early neural differentiation stage. In in vitro cardiac developmental toxicity test using mouse ESCs, Hand1-Luc EST or Cmya1-Luc EST have shown that heart and neural crest derivatives expressed transcript1 (Hand1) and cardiomyopathy associated 1 (Cmya1) during early cardiac development (40). Thus, the neural biomarkers suggested in this study could be useful for developing a neural development toxicity test. In addition, deficiencies or abnormalities of particular genes may result in differences in interpersonal neurotoxic effects of specific drugs, such as 5-fluorouracil. If hiPSCs, which can reflect the genetic characteristics of an individual, are applied with hESCs in such a neural development toxicity test, personalized toxicity evaluation will be possible by comparing the differences between them. Also, it is possible to establish an in vitro disease model by exposing neural cells differentiated from hESCs/hiPSCs to hypoxic-hypercapnic conditions as a model for evaluating drug efficacy by inducing hypoxic-ischemic encephalopathy through perinatal asphyxia in neonatal animals (46). Although neurogenesis of stem cells is widely used in the field of regenerative medicine research (47), it is also worthy of application in the field of evaluating drug toxicity and efficacy.
In conclusion, our developmental neurotoxicity test method evaluated a cytotoxic endpoint and molecular endpoints using hESCs and these results have provided biomarkers for neurotoxicity and new information related to possible actions of toxic chemicals during early neurogenesis of hESCs. The use of triangular charts for evaluation of concentration is effective when screening and evaluating biomarkers. Bias in the direction of the triangle refers to the reactivity to the concentration, and the triangle area represents the degree of toxicity. Several biomarkers, such as GAD1, CNP, OLIG2, FABP, NES, and TUBB3, have potential for determining the neurotoxicity of pharmacological compounds.
Acknowledgements: This work was supported by the National Research Fundation of Korea (NRF) grant of Korean government (MEST) (No. 2017R1A2B2005031).
Conflict of interests: None declared.
REFERENCES
- Dorman DC, Allen SL, Byczkowski JZ, et al. Methods to identify and characterize developmental neurotoxicity for human health risk assessment. III: pharmacokinetic and pharmacodynamic considerations. Environ Health Perspect 2001; 109 (Suppl 1): 101-111.
- Kavlock RJ, Austin CP, Tice RR. Toxicity testing in the 21st century: implications for human health risk assessment. Risk Anal 2009; 29: 485-487. Discussion 492-487.
- Crofton KM, Mundy WR, Lein PJ, et al. Developmental neurotoxicity testing: recommendations for developing alternative methods for the screening and prioritization of chemicals. ALTEX 2011; 28: 9-15.
- Itskovitz-Eldor J, Schuldiner M, Karsenti D, et al. Differentiation of human embryonic stem cells into embryoid bodies compromising the three embryonic germ layers. Mol Med 2000; 6: 88-95.
- Liu H, Zhang SC. Specification of neuronal and glial subtypes from human pluripotent stem cells. Cell Mol Life Sci 2011; 68: 3995-4008.
- Ginis I, Luo Y, Miura T, et al. Differences between human and mouse embryonic stem cells. Dev Biol 2004; 269: 360-380.
- Jensen J, Hyllner J, Bjorquist P. Human embryonic stem cell technologies and drug discovery. J Cell Physiol 2009; 219: 513-519.
- Krtolica A, Giritharan G. Use of human embryonic stem cell-based models for male reproductive toxicity screening. Syst Biol Reprod Med 2010; 56: 213-221.
- Hong EJ, Jeung EB. Assessment of developmental toxicants using human embryonic stem cells. Toxicol Res 2013; 29: 221-227.
- Jelitai M, Anderova M, Chvatal A, Madarasz E. Electrophysiological characterization of neural stem/progenitor cells during in vitro differentiation: study with an immortalized neuroectodermal cell line. J Neurosci Res 2007; 85: 1606-1617.
- Aimone JB, Li Y, Lee SW, Clemenson GD, Deng W, Gage FH. Regulation and function of adult neurogenesis: from genes to cognition. Physiol Rev 2014; 94: 991-1026.
- Hensley ML, Peterson B, Silver RT, Larson RA, Schiffer CA, Szatrowski TP. Risk factors for severe neuropsychiatric toxicity in patients receiving interferon alfa-2b and low-dose cytarabine for chronic myelogenous leukemia: analysis of Cancer and Leukemia Group B 9013. J Clin Oncol 2000; 18: 1301-1308.
- Cadman E, Eiferman F. Mechanism of synergistic cell killing when methotrexate precedes cytosine arabinoside: study of L1210 and human leukemic cells. J Clin Invest 1979; 64: 788-797.
- Dagg CP. Sensitive stages for the production of developmental abnormalities in mice with 5-fluorouracil. Am J Anat 1960; 106: 89-96.
- Longley DB, Latif T, Boyer J, Allen WL, Maxwell PJ, Johnston PG. The interaction of thymidylate synthase expression with p53-regulated signaling pathways in tumor cells. Semin Oncol 2003; 30 (3 Suppl. 6): 3-9.
- Sterkers Y, Preudhomme C, Lai JL, et al. Acute myeloid leukemia and myelodysplastic syndromes following essential thrombocythemia treated with hydroxyurea: high proportion of cases with 17p deletion. Blood 1998; 91: 616-622.
- Raymond E, Faivre S, Weiss G, et al. Effects of hydroxyurea on extrachromosomal DNA in patients with advanced ovarian carcinomas. Clin Cancer Res 2001; 7: 1171-1180.
- Koc A, Wheeler LJ, Mathews CK, Merrill GF. Hydroxyurea arrests DNA replication by a mechanism that preserves basal dNTP pools. J Biol Chem 2004; 279: 223-230.
- Ylitalo P, Pitkajarvi T, Pyykonen ML, Nurmi AK, Seppala E, Vapaatalo H. Inhibition of prostaglandin synthesis by indomethacin interacts with the antihypertensive effect of atenolol. Clin Pharmacol Ther 1985; 38: 443-449.
- Xu X, Li B. Fertile transgenic Indica rice plants obtained by electroporation of the seed embryo cells. Plant Cell Rep 1994; 13: 237-242.
- Jung EM, Choi YU, Kang HS, et al. Evaluation of developmental toxicity using undifferentiated human embryonic stem cells. J Appl Toxicol 2015; 35: 205-218.
- Schwartz MP, Hou Z, Propson NE, et al. Human pluripotent stem cell-derived neural constructs for predicting neural toxicity. Proc Natl Acad Sci USA 2015; 112: 12516-12521.
- Ninomiya H, Kishida K, Ohno Y, Tsurumi K, Eto K. Effects of cytosine arabinoside on rat and rabbit embryos cultured in vitro. Toxicol in vitro 1994; 8: 109-116.
- Ortega A, Puig M, Domingo JL. Maternal and developmental toxicity of low doses of cytosine arabinoside in mice. Teratology 1991; 44: 379-384.
- Sano T, Utsumi D, Amagase K, et al. Lafutidine, a histamine H2 receptor antagonist with mucosal protective properties, attenuates 5-fluorouracil-induced intestinal mucositis in mice through activation of extrinsic primary afferent neurons. J Physiol Pharmacol 2017; 68: 79-90.
- Shehata N, Pater A, Tang SC. Prolonged severe 5-fluorouracil-associated neurotoxicity in a patient with dihydropyrimidine dehydrogenase deficiency. Cancer Invest 1999; 17: 201-205.
- van Kuilenburg AB, Haasjes J, Richel DJ, et al. Clinical implications of dihydropyrimidine dehydrogenase (DPD) deficiency in patients with severe 5-fluorouracil-associated toxicity: identification of new mutations in the DPD gene. Clin Cancer Res 2000; 6: 4705-4712.
- Werbrouck BF, Pauwels WJ, De Bleecker JL. A case of 5-fluorouracil-induced peripheral neuropathy. Clin Toxicol (Phila) 2008; 46: 264-266.
- Hansen DK, Grafton TF, Cross DR, James SJ. Partial attenuation of hydroxyurea-induced embryotoxicity by deoxyribonucleotides in mouse and rat embryos treated in vitro. Toxicol in vitro 1995; 9: 11-19.
- Sacchetti P, Carpentier R, Segard P, Olive-Cren C, Lefebvre P. Multiple signaling pathways regulate the transcriptional activity of the orphan nuclear receptor NURR1. Nucleic Acids Res 2006; 34: 5515-5527.
- Phillis JW, Smith-Barbour M, Perkins LM, O’Regan MH. Indomethacin modulates ischemia-evoked release of glutamate and adenosine from the rat cerebral cortex. Brain Res 1994; 652: 353-356.
- Scott A, Alfredson H, Forsgren S. VGluT2 expression in painful Achilles and patellar tendinosis: evidence of local glutamate release by tenocytes. J Orthop Res 2008; 26: 685-692.
- Simonin A, Montalbetti N, Gyimesi G, Pujol-Gimenez J, Hediger MA. The hydroxyl side chain of a highly conserved serine residue is required for cation selectivity and substrate transport in the glial glutamate transporter GLT-1/SLC1A2. J Biol Chem 2015; 290: 30464-30474.
- Carbone M, Duty S, Rattray M. Riluzole elevates GLT-1 activity and levels in striatal astrocytes. Neurochem Int 2012; 60: 31-38.
- Heberden C, Meffray E, Goustard-Langelier B, Maximin E, Lavialle M. Dexamethasone inhibits the maturation of newly formed neurons and glia supplemented with polyunsaturated fatty acids. J Steroid Biochem Mol Biol 2013; 138: 395-402.
- Ishimoto T, Nakamichi N, Hosotani H, Masuo Y, Sugiura T, Kato Y. Organic cation transporter-mediated ergothioneine uptake in mouse neural progenitor cells suppresses proliferation and promotes differentiation into neurons. PLoS One 2014; 9: e89434. doi: 10.1371/journal.pone. 0089434
- Thompson CM, Davis E, Carrigan CN, Cox HD, Bridges RJ, Gerdes JM. Inhibitor of the glutamate vesicular transporter (VGLUT). Curr Med Chem 2005; 12: 2041-2056.
- Lai TW, Zhang S, Wang YT. Excitotoxicity and stroke: identifying novel targets for neuroprotection. Prog Neurobiol 2014; 115: 157-188.
- Doble A. The role of excitotoxicity in neurodegenerative disease: implications for therapy. Pharmacol Ther 1999; 81: 163-221.
- Suzuki N, Ando S, Yamashita N, Horie N, Saito K. Evaluation of novel high-throughput embryonic stem cell tests with new molecular markers for screening embryotoxic chemicals in vitro. Toxicol Sci 2011; 124: 460-471.
- Don S, Verrills NM, Liaw TY, et al. Neuronal-associated microtubule proteins class III beta-tubulin and MAP2c in neuroblastoma: role in resistance to microtubule-targeted drugs. Mol Cancer Ther 2004; 3: 1137-1146.
- Krug AK, Kolde R, Gaspar JA, et al. Human embryonic stem cell-derived test systems for developmental neurotoxicity: a transcriptomics approach. Arch Toxicol 2013; 87: 123-143.
- Robinson JF, Gormley MJ, Fisher SJ. A genomics-based framework for identifying biomarkers of human neurodevelopmental toxicity. Reprod Toxicol 2016; 60: 1-10.
- Novellino A, Scelfo B, Palosaari T, et al. Development of micro-electrode array based tests for neurotoxicity: assessment of interlaboratory reproducibility with neuroactive chemicals. Front Neuroeng 2011; 4: 4. doi: 10.3389/fneng.2011.00004
- Johnstone AF, Gross GW, Weiss DG, Schroeder OH, Gramowski A, Shafer TJ. Microelectrode arrays: a physiologically based neurotoxicity testing platform for the 21st century. Neurotoxicology 2010; 31: 331-350.
- Nemeth J, Toth-Szuki V, Varga V, Kovacs V, Remzso G, Domoki F. Molecular hydrogen affords neuroprotection in a translational piglet model of hypoxic-ischemic encephalopathy. J Physiol Pharmacol 2016; 67: 677-689.
- Ratajczak J, Zuba-Surma E, Paczkowska E, Kucia M, Nowacki P, Ratajczak MZ. Stem cells for neural regeneration - a potential application of very small embryonic-like stem cells. J Physiol Pharmacol 2011; 62: 3-12.
- Scholz G, Pohl I, Genschow E, Klemm M, Spielmann H. Embryotoxicity screening using embryonic stem cells in vitro: correlation to in vivo teratogenicity. Cells Tissues Organs 1999; 165: 203-211.
- Scholz G, Genschow E, Pohl I, et al. Prevalidation of the Embryonic Stem Cell Test (EST)-A New in vitro Embryotoxicity Test. Toxicol in vitro 1999; 13: 675-681.
A c c e p t e d : April 20, 2017