CHARACTERIZATION OF AGE-DEPENDENT DECLINE IN SPONTANEOUS RUNNING PERFORMANCE IN THE HEART FAILURE Tgαq*44 MICE
INTRODUCTION
Whole body physical exercise exerts varied adaptive stimulus to all vital organs of the body, including the brain, the lungs, the liver, the skeletal muscle and the heart (1-5). Accordingly, there is evidence suggesting that regular physical activity plays a key role in maintaining a good health of young individuals and in slowing-down the process of aging (1, 3, 6-11). On the other hand, physical inactivity is considered a major cause of chronic diseases (12) and a poor exercise capacity is considered a strong predictor of all-cause mortality in humans (13-15). One of the most important factor that decrease the level of spontaneous physical activity of the elderly people is the aging-related progression of the heart failure (HF) (16).
Little however is known, regarding which variables of the functional characteristics of the spontaneous physical activities, describing the endurance capacities and the sprinting abilities as well as the “willingness” to initiate running exercise, are predominantly affected by the progression of the HF. This is why in this study we aimed, using the murine model of HF (Tgαq*44 mice), to provide a new data showing how aging of the Tgαq*44 mice affects various parameters of the spontaneous physical performance of the mice in relation to the normally aging wild-type FVB mice. The murine model of HF (Tgαq*44 mice) results from a cardiac-specific overexpression of the constitutively active Gαq* protein (17). In this model of HF, the activation of hypertrophic genes and myocardial fibrosis are evident starting from ~4 months of age, cardiac contractile and mitochondrial functions progressively deteriorate at 8 – 10 months of age. Finally, the end-stage heart failure usually accurs at the age of ≥ 12.5 months of age, leading to the animals’ death (17-22). Using this model, in the present study we have analyzed the impact of aging on a number of parameters of spontaneous running performance of the HF mice, describing their endurance and maximal speed performance abilities, as well as the “willingness” to initiate spontaneous running in a wheel, in relation to the age-matched wild type FVB mice. Namely, in the present study we aimed to: (i) provide a quantitative characteristics of spontaneous exercise performance including the sprinting and endurance exercise capacity of the Tgαq*44 and the FVB mice; (ii) show the impact of aging of the Tgαq*44 and the FVB mice on their endurance and sprint performance; (iii) determine which of the studied spontaneous running performance variables best reflect the deteriorated exercise tolerance in the aged HF mice. We have hypothesized that onset of the aging-related reduction in the spontaneous running performance in the HF Tgαq*44 mice will occur at a younger age than in the FVB mice. Furthermore, we were expecting that the aging will simultaneously lower the endurance and the sprint running performance as well as the “willingness” to initiate running in the studied mice.
MATERIAL AND METHODS
Ethical approval
This study was conducted according to the Guidelines for Animal Care and Treatment of the European Union (EU Directive 2010/63/EU for animal experiments), and were approved by the Local Ethics Committee in Cracow (approval No. 37/2013).
Animals
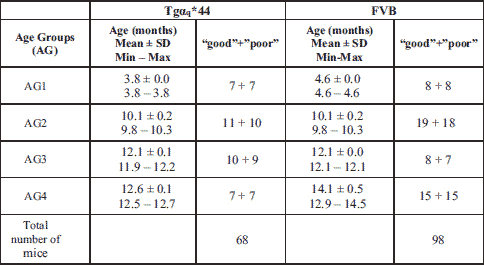
We collected data for two cohorts of adult female mice (wild-type FVB (FVB) and transgenic homozygous Tgαq*44 (Tg)) and analyzed the collected data in four age groups: ~4, ~10, ~12 and ≥12.5 months of age at the start of the study, further on labeled AG1, AG2, AG3 and AG4, respectively. Table 1 presents details regarding the age and count size of in individual groups. The total number of examined subjects equals 166.
Running wheel equipment and mice activity
Mice were housed one per cage (floor area of 355 × 235 × 190 mm) and maintained at 22 – 24ºC under a 12:12-h light-dark cycle with ad libitum access to water and rodent chow (standard chow, AIN from Zoolab, Cracow, Poland). In the first stage of every experiment, mice could not perform any spontaneous effort in the cage because there they were placed in individual cages without a running wheel. Next, in the second-main period of the experiment, cages was equipped with the running wheels with electronic system (Columbus Instruments, Columbus, OH, USA) allowing registering mice voluntary running activity. The system was programmed to record all running episodes at short intervals (10 s). In other words, the data collection system worked non-stop (period of time ≥54 days) in the second stage of the experiment, collecting information on the number of revolutions per every 10 seconds, separately for each mouse.
Analysed parameters
One turn of the running wheel with diameter 3.5 inches corresponded to covering the distance of approximately 27.9 cm. Correspondingly, with n denoting the number of turns in a given 10 s interval, the distance covered within that interval was computed as d = n × 0.279 [m] and the average speed v = (d / 10 s) × 60 [m • min–1] in that interval was interpreted as the instantaneous speed, measured every 10 s.
We describe spontaneous mouse activity during experiment in various ways. The first is the analysis focused on the total distance (Dsum) covered by a mice the mouse during 54 days of experiment. The second approach is based on the analysis of the maximal distance (Dmax) covered in a single-effort and the number of efforts during experiment (N); where one single-effort means an uninterrupted sequence of a voluntary running activity of a mouse registered by the electronic system. It means that a single-effort could last any multiplicity of the basic 10 s interval (our recorded maximum value was close to 45 min). The next indicator was the maximum instantaneous speed (vmax), understood as the maximum instantaneous speed recorded over the whole time of the experiment. Finally, we analyzed also the mean speed (vmean) for the whole experiment (vmean equals Dsum divided by the time on running) and daily mean time of running (Tmean) which is the total number of hours spent on running by a mouse divided by 54 days - the duration of the experiment. We have also determined the total distance covered by a mice in 24 h (Dmean). Summarizing, in this study, the assessment of spontaneous physical activity of mice was based on the following parameters: Dsum, N, Dmax, vmax, vmean, Tmean and Dmean.
Statistical analysis
All data are reported as mean values ± SD and presented in figures as mean values ± SE. Normality of data was tested by means of the Lilliefors test. In some groups, the distributions were significantly different from the normal. Hence, the non-parametric Mann-Whitney U test was used for between-groups comparisons.
The analyses were conducted in two versions: (i) for the whole population of all mice (ALL) and (ii) for its two subgroups called “good runners“ and “poor runners”. A mouse with a given combination of levels of type and age factors was labelled as “good runner” (resp. “poor runner”), if the total distance covered by that mouse during the whole experiment (Dsum) was greater or equal (resp. smaller) than the sample median of Dsum values of all mice with the same combination of levels of type and age factors.
Significant (<0.05) p-values are reported in the figures. P-values in black mark the significant differences between Tgαq*44 and FVB, separately in different age groups. P-values in colors (red for Tgαq*44, blue for FVB) mark the significant differences between age groups. The statistical analysis was performed using the STATISTICA data analysis software system, version 13 (TIBCO Software Inc.).
RESULTS
Daily running performance of the Tgαq*44 and the FVB mice
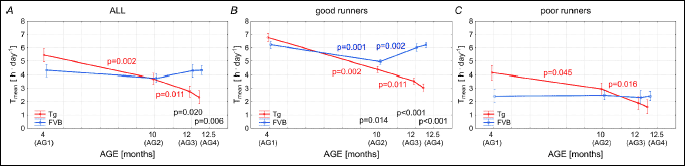
Daily time spent on running
The total time spent on running by the Tgαq*44 mice in the AG1 group amounted to 5.47 ± 1.96 h • 24 h–1 and it was not significantly different from the time spent on running by the FVB mice, for which it amounted to 4.33 ± 2.41 h • 24 h–1 (Fig. 1A). In the groups of the older Tgαq*44 mice the total time spent on running decreased with aging (opposite to the FVB mice in which it remain relatively stable) to reach in the AG4 the level of ~2.5 h • 24 h–1 (Fig. 1A). In the AG3 and AG4 the total time spent on running was significantly lower than in FVB mice in these age groups (Fig. 1A). In case of the “good runners” Tgαq*44 mice a near linear decrease in the total time spent on running was observed and in the groups of older animals (AG2-AG4) it was significantly lower than in the FVB mice (Fig. 1B). In the case of the “poor runners” Tgαq*44 mice the amount of time spent on running by the mice from the group AG1 amounting to 4 h • 24 h–1 was not significantly higher than that of the FVB mice (2.5 h • 24 h–1). In the case of the Tgαq*44 mice a significant decrease of the amount of time spent on running was observed in the older mice, whereas in the FVB mice the corresponding levels were very stable (about 2.5 h • 24 h–1) (Fig. 1C). The amounts of time spent on running by the Tgαq*44 and the FVB mice were significantly different in none of the studied age groups of animals (Fig. 1C).
Mean running speed
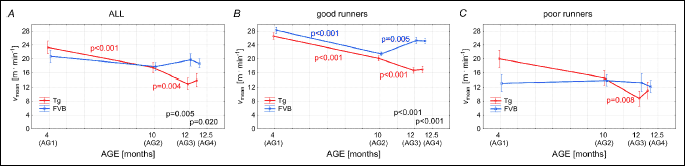
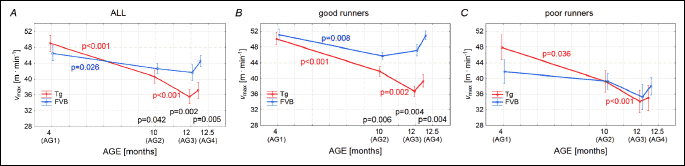
Fig. 2A shows the mean running speed (vmean) of the all studied mice. In the group AG1 the vmean of Tgαq*44 mice amounted to 23.3 ± 7.3 m • min–1 and it was not statistically different from the vmean of the FVB mice amounting to 20.8 ± 10.0 m • min–1 in this age group. The vmean of the FVB mice in all groups of age (AG1-AG4) remained relatively stable, whereas in cases of the Tgαq*44 mice a clear decline of the vmean was observed (Fig. 2A). It should be noticed that the vmean of the Tgαq*44 mice from the groups AG3 and AG4 was significantly lower that the FVB mice from the same age groups (Fig. 5A). Similar pattern of changes with age of the vmean was found in the case of the “good runners” mice. Namely, the vmean of the Tgαq*44 mice from the AG3 and AG4 was significantly lower than that in the FVB mice (Fig. 2B). The level of the vmean of the FVB belonging to the “good runners” group of mice was relatively stable (Fig. 2C), whereas in the case of Tgαq*44 mice a decreasing trend in vmean was observed (with significant difference between AG2 and AG3) (Fig. 2C). In general no significant differences in vmean were observed in this variable between the Tgαq*44 and the FVB in various age groups (AG1-AG4).
Mean daily distance
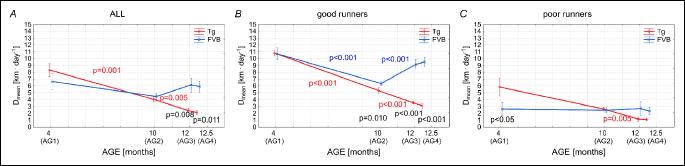
Fig. 3A shows the mean distance covered daily (Dmean) by all studied mice. In the group AG1, Dmean of Tgαq*44 mice amounted to 8.3 ± 3.6 km • 24–1 and it was not statistically different from the Dmean of the FVB mice amounting to 6.7 ± 4.8 km • 24 h–1 in this age group. The Dmean of the FVB mice in all age groups (AG1-AG4) remained relatively stable, whereas in cases of the Tgαq*44 mice a clear decline of Dmean was observed (Fig. 3A). It should be noticed that Dmean of the Tgαq*44 mice in the groups AG3 and AG4 was significantly lower than that of the FVB mice in the same groups of age (Fig. 3A). Similar pattern of changes with age of the Dmean was found in case of the “good runners” mice. Namely Dmean of the Tgαq*44 mice from the AG3 and AG4 was significantly lower than that in the FVB mice (Fig. 3B). The level of Dmean of the FVB mice in the group “poor runners” was rather stable at about 2.5 km • 24h–1 (Fig. 3C), whereas in case of Tgαq*44 mice a decreasing trend in Dmean was observed with age (Fig. 3C).
Maximal and minimal individual running performance
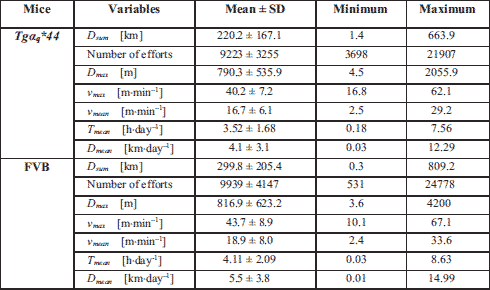
The mean, minimal and maximal level of the studied running performance variables (vmean, Dsum, Tmean, Dmax, vmax and number of efforts) of the Tgαq*44 mice and the FVB mice obtained during the 54 weeks of recording are presented in Table 2.
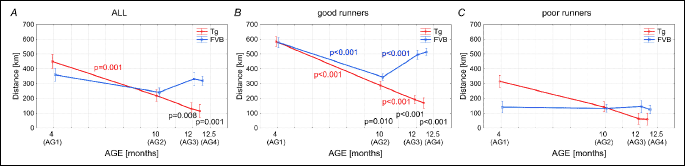
Total distance (Dsum) covered by mice
As present in Fig. 4A, the total distances (km) covered (Dsum) by the Tgαq*44 and the FVB mice from the AG1 amounting to 449.9 ± 192.3 km in case of the Tgαq*44 mice and 359.9 ± 261.9 km in case of the FVB mice, were not statistically different. Also, no difference between the Dsum in both groups of mice was found in case of the AG2. However, the Dsum reached by the Tgαq*44 mice belonging to the AG2 and AG3 was significantly lower than in the FVB mice. The Dsum of the Tgαq*44 mice belonging to AG3 and AG4 amounting to 130.5 ± 76.4 and 114.5 ± 68.1 km, was about 3 times lower than in FVB mice (Fig. 4A). A similar, and even more pronounced pattern is observed in the “good runners” sub-group (Fig. 4B). Namely, no difference in the total distance covered by the Tgαq*44 and the FVB mice from the AG1 was found, whereas in case of the AG2, AG3 and AG4 groups the Dsum reached by the Tgαq*44 mice was significantly lower than by the FVB mice (Fig. 4B). Surprisingly, no significant difference in the total distance of running by the Tgαq*44 and the FVB was found in the sub-group of the “poor runners” mice belonging to the AG1, AG2, AG3 and AG4 of mice (Fig. 4C).
The number of efforts undertaken by the mice
The number of efforts registered in the all studied mice in various age groups follows similar pattern (Fig. 5A). The only group in which the number of running events undertaken by the Tgαq*44 mice was significantly lower than by the FVB mice was the AG4 (Fig. 5A). As presented in Fig. 5 the average numbers of efforts in all analyzed groups of mice were very similar, amounting to 9223 in Tgαq*44 mice and 9939 in FVB mice (considered as all - Fig. 5A), 8612 in Tgαq*44 and 10086 in FVB mice (in group “good runners” - Fig. 5B) and 9870 in Tgαq*44 and 9786 in FVB mice (in group “poor runners” - Fig. 5C). As for the “poor runners” (Fig. 5B), the total number of efforts undertaken by the Tgαq*44 and the FVB mice from the AG1, AG2 and AG3 was similar with a tendency towards lower amount of running events undertaken by the Tgαq*44 mice. Only in the AG4 group this difference become statistically significant (Fig. 5B). In the group of “poor runners” the amount of runs undertaken by the Tgαq*44 and the FVB mice was similar in all age groups (Fig. 5C).
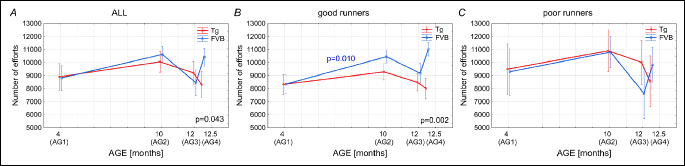
The total number of efforts undertaken by the Tgαq*44 and the FVB mice (from all groups during the 54 days of study, when considering all the studied mice (Fig. 5A) amounted to 627143 for Tgαq*44 and 974023 for the FVB mice (i.e. about 36% less in Tgαq*44 than in the FVB).
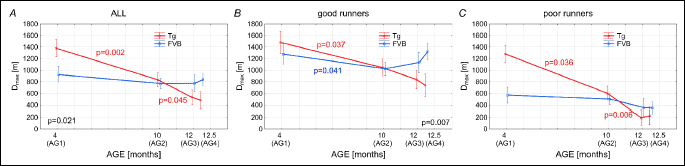
The maximal distance covered in a single-running event by the mice
As presented in Fig. 6A, the maximal distance (Dmax) covered in a single-running event by the youngest (AG1) Tgαq*44 mice amounting to 1381 m was much longer then by the FVB mice (925 m). Interestingly, the Dmax in cases of the Tgαq*44 mice decreases in the older groups of mice (AG2 and AG3) but in the AG4 group there is no significant difference between the Dmax in the Tgαq*44 and the FVB mice. The Dmax of the old Tgαq*44 mice belonging to the AG4 which amounted to 481.5 m was by 2.87 times lower than the Dmax of the young Tgαq*44 mice belonging to the AG1. In case of the FVB mice the Dmax remained stable at the level of about 820 m in all four groups of mice (AG1-AG4) (Fig. 6A). In case of the “good runners” mice the Dmax in the AG1was higher in the Tgαq*44 than in the FVB mice, whereas in the AG4, the Dmax in the Tg mice was significantly lower than in the FVB mice (Fig. 6B). In case of the mice from the “poor runners” group (Fig. 6C), the Dmax of the Tgαq*44 mice was the highest in the AG1 and it decreased significantly in the AG2 and AG3. No significant differences were found between the Dmax of the Tgαq*44 and the FVB mice belonging to the AG1-AG4 (Fig. 6C).
Maximum instantaneous speed of run
As presented in Fig. 7A, the maximum instantaneous speed of run (vmax) when considering whole group of animals was the highest in the AG1. It amounted to 49.0 m • min–1 in the Tgαq*44 mice and to 46.4 m • min–1 in the FVB mice. It was not significantly different when comparing the Tgαq*44 and the FVB mice. However in the groups of the older animals (AG2, AG3 and AG4) the vmax in the Tgαq*44 mice becomes significantly lower than in the FVB mice (Fig. 4A). Analogous pattern of changes was observed in case of the mice from the “good runners” group (Fig. 7B). The vmax in the “poor runners” group of mice in case of the Tgαq*44 mice also a decrease in the older groups of animals but the differences between the vmax in the AG1, AG2, AG3 and AG4 was no significant (Fig. 7C).
Relative changes of running performance in aging Tgαq*44 mice and FVB mice
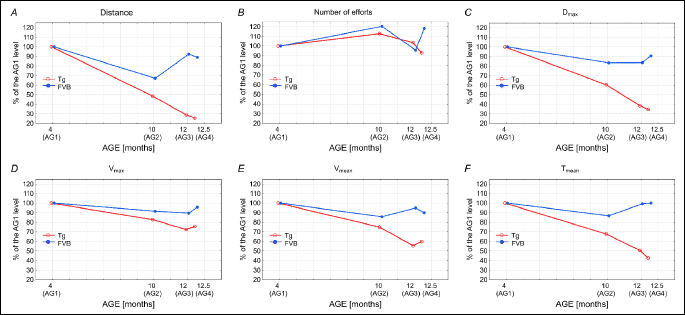
We have also presented the data describing the studied parameters of running performance of the Tgαq*44 and the FVB mice, expressed as percentage of respective in the youngest groups of mice (AG1) (Fig. 8A-8F). As shown in Fig. 4A, the amount of total distance covered by the Tgαq*44 mice decreases linearly in function of age - to reach in the AG3 about 25% of its initial level established in the AG1. In case of the FVB mice a clear decrease of the total distance of run can be noticed in AG2, but its level in the AG3 and AG4 is only about 10% lower than in the AG1 (Fig. 8A).
The number of efforts undertaken by the Tgαq*44 mice and the FVB remains relatively stable in all studied groups of animals. Finally, however in the Tgαq*44 mice belonging to the AG4 the number of efforts slightly decreases (by about 10%) in relation to its level in the AG1, but in case of the FVB mice belonging to the AG4 it exceeds its initial level by about 20% (Fig. 8B).
The maximal distance (Dmax) covered in a single-effort by the Tgαq*44 and the FVB mice decreases with an increase of age, but its steeper decrease can be seen in cases of the Tgαq*44 mice which in the AG4 perform only about 35% of the Dmax measured in the AG1. In case of the FVB mice the Dmax of the mice belonging to AG4 was only 10% lower than its level found in the animals belonging to the AG1 (Fig. 8C).
The maximum instantaneous speed of run (vmax) both in the Tgαq*44 mice as well as in the FVB mice decrease with aging but its decrease is clearly steeper in the Tgαq*44 mice. In the AG4 the vmax of the Tgαq*44 mice decreased by about 25% below its initial level, whereas in case of the FVB mice only by about 3% (Fig. 8D).
The mean running speed (vmean) of the Tgαq*44 mice decreases with an increase of animals age to amount in the AG4 about 60% of its initial level, whereas in case of the FVB mice the vmean in the AG4 decreased to only 90% of its initial level (Fig. 8E).
The mean time spent on running per 24 h (Tmean) in case of the Tgαq*44 mice decreased near linearly with an increase of age, to reach in the AG4 about 40% of its initial level. In case of the FVB the Tmean remained relatively stable in all age groups, except for the AG2 group in which a decrease by about 12% in relation to its initial level can be seen (Fig. 8F).
Correlations and time trends
The relationship between the studied variables characterizing running performance of the Tgαq*44 (Fig. 9A-9H) and the FVB (Fig. 10A-10H) was quantified with correlation analysis.
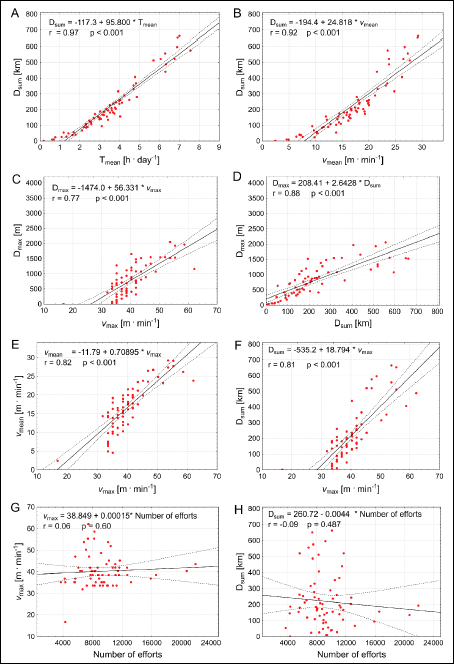 |
Fig. 9. Correlations between selected variables charactering running performance of the Tgαq*44 mice, including the total distance (Dsum) covered by the mice during 54 days of experiment, including the maximal distance (Dmax) covered in single-effort, the mean time spent on running per 24 h (Tmean), the mean running speed (vmean), the maximum instantaneous speed of run (vmax) and the number of efforts (i.e. the amount of running events undertaken by the mice) (N). |
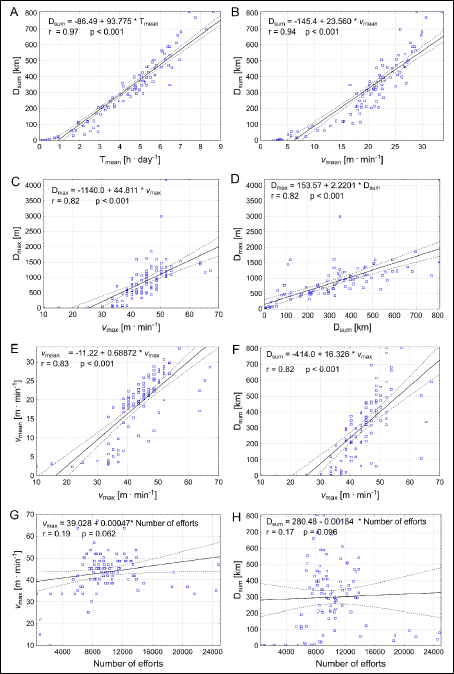 |
Fig. 10. Correlations between selected variables characterizing running performance of the FVB mice, including the total distance (Dsum) covered by the mice during 54 days of experiment, the maximal distance (Dmax) covered in single-effort, mean time spent on running per 24 h (Tmean), the mean running speed (vmean), the maximum instantaneous speed of run (vmax) and the number of efforts (i.e. the amount of running events undertaken by the mice) (N). |
Changes of vmax and Dmean
Fig. 11 presents the level of vmax (panel A) and Dmean (panel B) in varied groups of animals, during successive days of the 54 days’ long recording period.
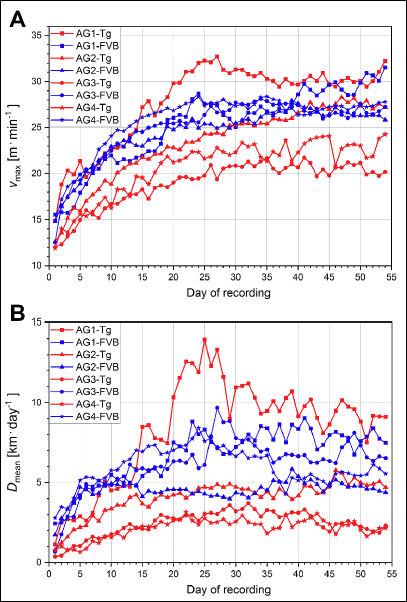 |
Fig. 11. Level of the maximum instantaneous speed of run (vmax) (panel A) and the total distance covered by the Tgαq*44 and the FVB mice from varied age groups (AG1-AG4) mice in 24 h (Dmean) (panel B) during successive days of the 54 days’ long recording period. |
DISCUSSION
Running performance of the FVB and the Tgαq*44 mice at young age
The present study revealed that the FVB mice as well as the Tgαq*44 mice at young age of 4 months (AG1) presented an impressive level of daily spontaneous physical activity. Specifically, as shown in Fig. 1, the group average time of daily spontaneous physical activity (Tmean) of the FVB mice amounted to 4.33 ± 2.41 h • day–1 and in the Tgαq*44 mice to 5.47 ± 1.96 h • day–1, covering on average to 6.7 ± 4.8 and 8.3 ± 3.6 km • 24 h–1, respectively by the FVB and the Tgαq*44 mice (see the Dmean values in Fig. 3). Their maximal instantaneous speed of running (vmax) amounted to 49.0 ± 10.9 m • min–1 and 46.4 ± 13.5 m • min–1, for the Tgαq*44 and the FVB mice, respectively (Fig. 7) - with an individual maximum exceeding 60 m • min–1 both in cases of the Tgαq*44 mice and the FVB mice. Interestingly, the highest vmax and the Dmean found in our study amounting respectively 67.1 m • min–1 and 14.99 km • 24 h–1 are close to those reported by others. The total distance (km) covered within 54 days (Dsum) by the Tg and the FVB mice from the AG1 group considered as “all” was similar in both groups of the young animals and amounted to 449.9 ± 192.3 km in case of the Tgαq*44 mice mice and 359.9 ± 261.9 km in case of the FVB mice (Fig. 4A). Summing up, several parameters of the spontaneous running performance of the young Tgαq*44 and the FVB mice in our study, as presented above are comparable to that, observed by others in varied various mice strains (11, 23-25). Furthermore, the running performance of the Tgαq*44 and the FVB mice at the age of 4 months is very similar, however the slow development of cardiac and systemic consequences of cardiac insufficiency present in Tgαq*44 mice at older age results in exercise intolerance. This mimic the chronic HF phenotype observed in humans, which makes Tgαq*44 model very suitable for studies of pathophysiology of HF in humans. Tgαq*44 mice studied at varied ages - as in the present study (4 and 10 and 12 months old) - can provide new insights into the impact of the progression of HF (from early through transitional up to late stages of HF development) on voluntary exercise capacity in patients.
The above data clearly illustrate that a normal daily physical activities of the Tgαq*44 and the FVB mice at their young age are indeed impressive. This fact should be kept in mind when planning the amount of training intervention in a form of running on a motor driven treadmill, frequently used in a study involving a mouse model (11). Namely, the mice in their spontaneous training activities show that they need far more physical activities for their healthy life than the researches offer them in the training intervention program regimes, during which frequently they limit the amount of running of mice up to 1 h per day to be performed 5 times a week. Accordingly, we postulate that when studying the effect of forced physical training on the mice, e.g., using a treadmill, the animals should have in their cages a 24 h access to running wheels, equipped with a system allowing to measure their basis voluntary physical activity. Namely, the total daily amount of the mice’s physical activities i.e., (the amount running on the treadmill plus the amount of running in the wheel) should be taken into consideration when studying the effect of a forced training programs (e.g., running on a treadmill) on various organs of the mice, since the frequently used doses of the forced training (<1 h per 24 h) constitute only a small fraction of the normal spontaneous physical activity in mice, therefore can be insufficient to develop the expected adaptive responses in the studied animals. It should also be underlined that voluntary running in wheels, as opposed to forced running on a treadmill, does not require aversive stimuli (like e.g. electric shocks) to motivate animals to run and allows the animals to perform their physical activities in their normal active phase of the day (11). Therefore, this mode of physical training, being less stressful to the animals, might be more appropriate to study various phenomena in exercise physiology then the forced running on a treadmill.
Another issue that should be taken into consideration when planning a study that involves animals training interventions is the varying level of their physical capacity. Based on the total distance (km) covered by an individual mouse during the 54 days we have called then the “good runners” and the “poor runners”. The main difference in running behaviours between the “good runners” and the “poor runners” was the total daily time of voluntary running (Fig. 1) and the mean running velocity (Fig. 2), resulting in the differences between the total distance (km) covered by an individual mouse during the 54 days (Fig. 4). This huge heterogeneity in voluntary running performance of mice should be taken into consideration when planning a study involving the voluntary running / physical activity of mice as a model of physical training. Interestingly, as presented in Fig. 8, the number of efforts undertaken by the “poor runners” was at a similar level as in the “good runners”. This shows that not the “willingness” to initiate running but other factors determine the animals exercise capacity (26) make the animal a “poor runner” or a “good runner”.
Factors determining the mice endurance running performance
As presented in Figs. 9A and 10A the Dsum was very highly correlated with the Tmean, both in cases of the Tgαq*44 and the FVB mice, respectively. Furthermore the Dsum was also highly correlated with the vmean (Figs. 9B and 10B) as well as with the Dmax (Figs. 9D and 10D). This illustrates that the magnitude of the total distance covered by the Tgαq*44 and the FVB mice within 54 days was strongly depended upon the endurance capacity of the mice expressed by the level of their Tmean, vmean and the Dmax. Interestingly, there was no correlation between the number of efforts undertaken by the animals with the vmax and with the Dsum (Figs. 9G-9H, and 10G-10H).
As presented in Figs. 9C and 10C, the Dmax significantly correlated with the vmax, which shows that the fastest mice presented also the highest endurance capacities. This could be also confirmed by the high correlations found between the Dsum and the vmax (Figs. 9F and 10F). Furthermore, the vmean correlated with the vmax (Figs. 9E and 10E). Surprisingly, this clearly shows that both in case of the Tgαq*44 and the FVB mice, the highest sprinting capacities expressed by the (vmax) appeared to be connected with the highest endurance capacity, expressed by the highest Dsum, Dmax and vmean. Namely, the mice which presented the highest sprinting ability possessed also the highest endurance capacity. This is an interesting and somehow surprising observation, since one would expect that in mice, like in humans (27), especially in sportsmen’s the sprinting and the endurance capacities should be dissociated from each other. Our explanation of the association of the sprinting and the endurance capacities in the mice would be as follows. We conjecture that the observed association of sprinting with the endurance capacities in the mice results rather from their general locomotor profile. Most likely, they train spontaneously both skills to survive in natural conditions, as opposed to athletes who selectively train sprint or develop their endurance. Therefore, the mice profile of locomotor ability remains rather the cases of untrained healthy people, among which some of them are naturally more and the other less skilled to run at a broad range of running velocities.
Running performance of the FVB and the Tgαq*44 mice at older age
As presented in Fig. 8, the level of the studied variables describing the level of spontaneous physical activities of the FVB mice at the age of ~14 months (the group AG4) remained essentially unchanged when compared to its level found in the young animals of 4 months old (the group AG1). For overview of effect of aging on the level of the spontaneous physical activities of the FVB mice see Fig. 8. The essentially unchanged level of the spontaneous physical activities of the FVB mice can be explained by the fact that in cases of the FVB mice the age of ~14 months was still relatively low i.e. about 50% of their maximal life span, since as reported by Mahler et al., (28), in their study about 60% of the FVB mice survival to 24 months of age.
Opposite effect i.e. a pronounced deterioration of the level of spontaneous physical activities was found in the aging Tgαq*44 mice (Figs. 1-7). Namely, at the age of ≥12.5 months (the group AG4) the Dsum, Dmax, Tmean and vmean in the Tgαq*44 mice was decreased by ~50%, when compared to their levels at the age of ~4 months. For overview of the effect of aging on the level of the spontaneous physical activities of the FVB mice, see Fig. 8. This clearly illustrates that the endurance running capacity in the Tgαq*44 mice dramatically decreases within ~8 months of their live i.e. between the 4th and ≥12.5th month of their live. This can be explained by a progression of their HF at relatively young age when compared to the FVB mice. Finally a clinically evident cardiac decompensation in the Tgαq*44 mice usually occurs at ~12 – 14 months of age, leading to the animals’ death (17-22).
We have previously reported that the cardiac function of the Tgαq*44 mice at their age of ~12 – 14 months was significantly compromised when compared to healthy FVB mice (21, 29, 30). The decrease of the maximal cardiac output resulting in a limited O2 delivery would be a sufficient factor to limit their endurance performance (31-35). We postulate that the rate of decline of the spontaneous physical activity of the Tgαq*44 mice including the Dsum, Dmean, Tmean and vmean (Fig. 8) can be a consequence of progression of their heart insufficiency.
Surprisingly, the aging of the Tgαq*44 mice had far lesser effect on their vmax and practically no effect on the number of efforts undertaken by them. The relatively well preserved level of vmax in the aged Tgαq*44 mice as shown in Fig. 8D is surprising, since it is well documented that aging decreases the amount of fast motor units in the locomotor muscles as well as decreases muscle force (36), a feature which directly affects maximal muscle power output and maximal running velocity. As shown in Fig. 8D the vmax of the 12.5 months old Tgαq*44 mice was by about 25% lower than in the 4 months old mice, which shows some effect of aging on the vmax, nevertheless this effect was far less pronounced than the above discussed effect of aging on the endurance performance of the Tgαq*44 mice (Fig. 8A, 8C, 8E and 8F). This compromised cardiac functioning in the aged Tgαq*44 mice by the limiting oxygen delivery could directly decrease their endurance capacity (31, 37). It has been shown that decreased intracellular oxygenation during exercise enhances the level of metabolites involved in muscle fatigue (38). A such disturbances in muscle metabolic stability involving decrease in muscle PCr, an increase in Pi, ADP, IMP, H+, NH3 and other metabolites, decreases muscle efficiency and causes muscle fatigue (26, 39-41). In case of performance a short term maximal bouts of exercise, the limited oxygen delivery to the muscle could be less harmful for exercise performance then during an endurance exercise, since during short term sprint exercise the muscle ATP need is supplied chiefly via creatine kinases reaction (41-43). Then paradoxically, the short term sprints capacities of the HF mice could be better preserved than the endurance capacity, especially when the pauses between those sprints would be long enough to recover their muscle PCr store.
According to this scenario, one could expect that a short term (lasting a few seconds) sub-maximal bout of exercise performed with a sufficient recovery time (minutes) should be better tolerated by the cardiac patients then a prolonged continuous high intensity aerobic bouts of exercise often recommended in their rehabilitation programs, as a strategy to slow-down the rate of development of sarcopenia and muscles weakness in cardiac patients.
Adaptation to running wheels
Another interesting issue related to characteristics of voluntary running performance of mice is the amount of running done by mice during successive days. Therefore, in the present study, we followed the changes in vmax and Dmean, that represent the maximum speed and the endurance performance of the mice, respectively. As shown in Fig. 11A and 11B), the level of vmax and Dmean in the initial days of the experiment (days 1 through 7) is much lower than in the subsequent weeks. In our study, vmax and Dmean reached a quasi-plateau level no sooner than after about the 20th day of the experiment. This illustrates that, in order to see the true level of voluntary running performance of mice, parameters should be recorded for at least about 4 weeks (for an overview of this point, see also ref. Poole et al. (11)).
Heart failure and the “motor executions”
In light of the current knowledge the decision to undertake a spontaneous moments e.g., an attempt of running called “motor executions” (44, 45) are generated in the motor cortex of the animals brain. In the present study we have followed the attempts of movements (an events longer than 10 s) performed in the running wheels. We have found that the amount of the efforts i.e. “motor executions” by the “good runners” and the “poor runners” from the FVB and the Tgαq*44 group of mice at a given age was not very much different from each other (Fig. 5A-5C). Whereas the Tmean, vmean and especially the Dsum were much higher in the “good runners” when compared to the “poor runners” (see Figs. 1, 2 and 4, respectively). This illustrates that even the “poor runners” mice presented a “willingness” to perform the running but for some reasons they could not maintain it for a longer period of time (Fig. 6).
Another interesting and to our best knowledge an original finding of our study is that the number of “motor executions” by the Tgαq*44 mice was not affected by the heart faiure progression (Fig. 8B). Namely, the Tgαq*44 mice, even at the age of 12 months tried to perform their exercises as frequently as the Tgαq*44 mice at young age (4 months old) (Fig. 8B), but the old Tgαq*44 mice could simply not to sustain a long distance of runs (Fig. 6). This suggests that the motor cortex of the brain is well preserved even at the end-stage of HF in the aging Tgαq*44 mice. Nevertheless, we cannot exclude a possibility of an appearance of varied aging-related dysfunctions in other brain regions of the HF mice. It has been shown that HF affects also brain’s structural integrity, including reduced regional cortical thicknesses in multiple brain areas that control autonomic, cognitive, affective, language, and visual functions (46). Furthermore, lower, and largely lateralized, cerebral blood flow in multiple autonomic, mood and cognitive regulatory sites of the brain has been reported in the HF patients (47). Similar changes in the brain might contribute to the observed exercise intolerance in the aged Tgαq*44 mice.
In conclusion: in the present study we have found that progression of heart failure in the Tgαq*44 mice results in huge decrease of their voluntary running performance. Namely, the endurance capacity of the Tgαq*44 mice at the age of ≥12.5 months was by ~50% lower, when compared to its level at the age of ~4 months. No effect of aging on running performance in the similar range of age was observed in the control FVB mice. Surprisingly, the “willingness” to initiate running (“motor executions”) by the Tgαq*44 mice at the age of 4 - 12 months remained unchanged. This suggests that the factors responsible for the exercise intolerance observed in the aging HF mice are not primary located in the central nervous system but most likely in the heart and in the aging muscles. Although, we cannot exclude the possible contribution of varied aging-related dysfunctions in other brain regions to the observed exercise intolerance of the aged Tgαq*44 mice.
Author’s contributions: JAZ was responsible for the conception and design of the work, the analysis and interpretation of data for the manuscript, and the drafting of the manuscript as well as for revising the manuscript critically for important intellectual content; ZN was responsible for the conception and design of the work, the data analysis, interpretation of data and preparation of figures and tables for the manuscript, as well as for revising the manuscript critically for important intellectual content; ZSz and JM were responsible for the data analysis and interpretation of the data and for revising the manuscript critically for important intellectual content; EP and SCh were responsible for interpretation of data, revising the manuscript critically for important intellectual content. All authors approved the final version of manuscript submitted for publication and agree to be accountable for all aspects of the work.
J.A. Zoladz and Z. Nieckarz contributed equally to this paper.
Acknowledgements: This study was supported by the Polish National Science Centre (OPUS 14 no. 2017/27/B/NZ7/01976 – a grant awarded to prof. Joanna Majerczak).
Conflict of interests: None declared.
REFERENCES
- Pedersen BK, Saltin B. Exercise as medicine - evidence for prescribing exercise as therapy in 26 different chronic diseases. Scand J Med Sci Sports 2015; 25 (Suppl 3): 1-72.
- Miklosz A, Baranowski M, Lukaszuk B, Zabielski P, Chabowski A, Gorski J. Effect of acute exercise on mRNA and protein expression of main components of the lipolytic complex in different skeletal muscle types in the rat. J Physiol Pharmacol 2019; 70: 425-433.
- Radak Z, Suzuki K, Posa A, Petrovszky Z, Koltai E, Boldogh I. The systemic role of SIRT1 in exercise mediated adaptation. Redox Biol 2020; 35: 101467. doi: 10.1016/j.redox.2020.101467
- Jarmuszkiewicz W, Dominiak K, Galganski L, et al. Lung mitochondria adaptation to endurance training in rats. Free Radical Biol Med 2020; 161: 163-174.
- Majerczak J, Filipowska J, Tylko G, et al. Impact of long-lasting spontaneous physical activity on bone morphogenetic protein 4 in the heart and tibia in murine model of heart failure. Physiol Rep 2020; 8: e14420. doi: 10.14814/phy2.14412
- Radak Z, Chung HY, Koltai E, Taylor AW, Goto S. Exercise, oxidative stress and hormesis. Ageing Res Rev 2008; 7: 34-42.
- Zoladz JA, Pilc A. The effect of physical activity on the brain derived neurotrophic factor: from animal to human studies. J Physiol Pharmacol 2010; 61: 533-541.
- Zoladz JA, Majerczak J, Zeligowska E, et al. Moderate-intensity interval training increases serum brain-derived neurotrophic factor level and decreases inflammation in Parkinson's disease patients. J Physiol Pharmacol 2014; 65: 441-448.
- Legard GE, Pedersen BK. Muscle as an endocrine organ. In: Muscle and Exercise Physiology, J.A. Zoladz (ed.). London, Elsevier Inc. Academic Press, 2019, pp. 285-307. doi: 10.1016/B978-0-12-814593-7.00018-13-X
- Majerczak J, Grandys M, Frolow M, et al. Age-dependent impairment in endothelial function and arterial stiffness in former high class male athletes is no different to that in men with no history of physical training. J Am Heart Assoc 2019; 8: e012670. doi: 10.1161/JAHA.119.012670
- Poole DC, Copp SW, Colburn TD, et al. Guidelines for animal exercise and training protocols for cardiovascular studies. Am J Physiol Heart Circ Physiol 2020; 318: H1100-H1138.
- Booth FW, Roberts CK, Thyfault JP, Ruegsegger GN, Toedebusch RG. Role of inactivity in chronic diseases: evolutionary insight and pathophysiological mechanisms. Physiol Rev 2017; 97: 1351-1402.
- Kokkinos P, Myers J, Kokkinos JP, et al. Exercise capacity and mortality in black and white men. Circulation 2008; 117: 614-622.
- Kokkinos P, Myers J, Faselis C, et al. Exercise capacity and mortality in older men: a 20-year follow-up study. Circulation 2010; 122: 790-797.
- Myers J, Nead KT, Chang P, Abella J, Kokkinos P, Leeper NJ. Improved reclassification of mortality risk by assessment of physical activity in patients referred for exercise testing. Am J Med 2015; 128: 396-402.
- Pina IL, Apstein CS, Balady GJ, et al. American Heart Association Committee on exercise, rehabilitation, and prevention. Exercise and heart failure: a statement from the American Heart Association Committee on exercise, rehabilitation, and prevention. Circulation 2003; 107: 1210-1225.
- Mende U, Semsarian C, Martins DC, et al. Dilated cardiomyopathy in two transgenic mouse lines expressing activated G protein alpha(q): lack of correlation between phospholipase C activation and the phenotype. J Mol Cell Cardiol 2001; 33: 1477-1491.
- Elas M, Bielanska J, Pustelny K, et al. Detection of mitochondrial dysfunction by EPR technique in mouse model of dilated cardiomyopathy. Free Radical Biol Med 2008; 45: 321-328.
- Mackiewicz U, Czarnowska E, Brudek M, et al. Preserved cardiomyocyte function and altered desmin pattern in transgenic mouse model of dilated cardiomyopathy. J Mol Cell Cardiol 2012; 52: 978-987.
- Czarnowska E, Bierla JB, Toczek M, et al. Narrow time window of metabolic changes associated with transition to overt heart failure in Tgαq*44 mice. Pharmacol Rep 2016; 68: 707-714.
- Tyrankiewicz U, Olkowicz M, Skorka T, et al. Activation pattern of ACE2/Ang-(1-7) and ACE/Ang II pathway in course of heart failure assessed by multiparametric MRI in vivo in Tgαq*44 mice. J Appl Physiol 2018; 124: 52-65.
- Berkowicz P, Kij A, Walczak M, Chlopicki S. Eicosanoid profiling in effluent of isolated perfused heart of Tgαq*44 mice with advanced heart failure. J Physiol Pharmacol 2019; 70: 135-142.
- Allen DL, Harrison BC, Maass A, Bell ML, Byrnes WC, Leinwand LA. Cardiac and skeletal muscle adaptations to voluntary wheel running in the mouse. J Appl Physiol 2001; 90: 1900-1908. [Erratum in: J Appl Physiol 91 (3), following table of contents].
- Lerman I, Harrison BC, Freeman K, et al. Genetic variability in forced and voluntary endurance exercise performance in seven inbred mouse strains. J Appl Physiol (1985) 2002; 92: 2245-2255.
- Fuller KN, Thyfault JP. Barriers in translating preclinical rodent exercise metabolism findings to human health. J Appl Physiol (1985) 2021; 130: 182-192.
- Grassi B, Rossiter HB, Zoladz JA. Skeletal muscle fatigue and decreased efficiency: two sides of the same coin? Exerc Sport Sci Rev 2015; 43: 75-83.
- Boulay MR, Lortie G, Simoneau JA, Hamel P, Leblanc C, Bouchard C. Specificity of aerobic and anaerobic work capacities and powers. Int J Sports Med 1985; 6: 325-328.
- Mahler JF, Stokes W, Mann PC, Takaoka M, Maronpot RR. Spontaneous lesions in aging FVB/N mice. Toxicol Pathol 1996; 24: 710-716.
- Grassi B, Majerczak J, Bardi E, et al. Exercise training in Tgαq*44 mice during the progression of chronic heart failure: cardiac vs. peripheral (soleus muscle) impairments to oxidative metabolism. J Appl Physiol 2017; 123: 326-336.
- Bardi E, Majerczak J, Zoladz JA, et al. Voluntary physical activity counteracts chronic heart failure progression affecting both cardiac function and skeletal muscle in the transgenic Tgαq*44 mouse model. Physiol Rep 2019; 7: e14161. doi: 10.14814/phy2.14161
- Andersen P, Saltin B. Maximal perfusion of skeletal muscle in man. J Physiol 1985; 366: 233-249.
- Richardson RS, Saltin, B. Human muscle blood flow and metabolism studied in the isolated quadriceps muscles. Med Sci Sports Exerc 1998; 30: 28-33.
- Mortensen SP, Dawson EA, Yoshiga CC, et al. Limitations to systemic and locomotor limb muscle oxygen delivery and uptake during maximal exercise in humans. J Physiol 2005; 566: 273-285.
- Zoladz JA, Majerczak J, Duda K, Chlopicki S. Coronary and muscle blood flow during physical exercise in humans; heterogenic alliance. Pharmacol Rep 2015; 67: 719-727.
- Duncker DJ, Bache RJ, Merkus D, Laughlin MH. Exercise and the coronary circulation. In: Muscle and Exercise Physiology, J.A. Zoladz (ed.). London, Elsevier Inc. Academic Press, 2019, pp. 467-503. doi: 10.1016/B978-0-12-814593-7.00022-0
- Degens H. Human ageing: impact on muscle force and power. . In: Muscle and Exercise Physiology, J.A. Zoladz (ed.). London, Elsevier Inc. Academic Press, 2019, pp. 423-432. doi: 10.1016/B978-0-12-814593-7.00019-0
- Hochachka PW. Muscles as Molecular and Metabolic Machines. Boca Raton, CRC Press LLC, 1994, pp. 95-118.
- Haseler LJ, Richardson RS, Videen JS, Hogan MC. Phosphocreatine hydrolysis during submaximal exercise: the effect of FIO2. J Appl Physiol 1998; 85: 1457-1463.
- Zoladz JA, Gladden LB, Hogan MC, Nieckarz Z, Grassi B. Progressive recruitment of muscle fibers is not necessary for the slow component of VO2 kinetics. J Appl Physiol 2008; 105: 575-580.
- Majerczak J, Korostynski M, Nieckarz Z, Szkutnik Z, Duda K, Zoladz JA. Endurance training decreases the non-linearity in the oxygen uptake-power output relationship in humans. Exp Physiol 2012; 97: 386-399.
- Zoladz JA, Grassi B, Szkutnik Z. Metabolic transitions and muscle metabolic stability. effects of exercise training. In: Muscle and Exercise Physiology, J.A. Zoladz (ed.). London, Elsevier Inc. Academic Press, 2019, pp. 391-422. doi: 10.1016/B978-0-12-814593-7.00018-9
- Sahlin K. Muscle energetics during explosive activities and potential effects of nutrition and training. Sports Med 2014; 44 (Suppl. 2): S167-S173.
- Hargreaves M, Spriet LL. Skeletal muscle energy metabolism during exercise. Nat Metab 2020; 2: 817-828.
- Svoboda K, Li N. Neural mechanisms of movement planning: motor cortex and beyond. Curr Opin Neurobiol 2018; 49: 33-41.
- Sauerbrei BA, Guo JZ, Cohen JD, et al. Cortical pattern generation during dexterous movement is input-driven. Nature 2020; 577: 386-391.
- Kumar R, Yadav SK, Palomares JA, et al. Reduced regional brain cortical thickness in patients with heart failure. PLoS One 2015; 10: e0126595. doi: 10.1371/journal.pone.0126595
- Roy B, Woo MA, Wang DJ, Fonarow GC, Harper RM, Kumar R. Reduced regional cerebral blood flow in patients with heart failure. Eur J Heart Fail 2017; 19: 1294-1302.
A c c e p t e d : April 30, 2021