EFFECT OF GHRELIN RECEPTOR AGONIST AND ANTAGONIST ON THE ACTIVITY OF ARCUATE NUCLEUS TYROSINE HYDROXYLASE CONTAINING NEURONS IN C57BL/6 MALE MICE EXPOSED TO NORMAL OR HIGH FAT DIET
INTRODUCTION
Ghrelin, a novel acylated 28 amino acid peptide, has been purified from rat stomach and identified as an endogenous ligand for the growth hormone secretagogue receptor (GHS-R) (1). Ghrelin has been shown to be involved in a series of physiological processes such as regulation of food intake, body weight, gastrointestinal, cardiovascular and immune function, and reproduction (2-4). Recently, using a radioligand ([(125)I-His(9)]-ghrelin), distribution and density of GHS-R have been demonstrated in the appetite-regulating structures, including the hypothalamic arcuate (ARC), ventromedial (VMN), paraventricular (PVN), and dorsomedial (DMN) nuclei and the lateral hypothalamic area (LHA) in rodents (5, 6).
ARC is an important structure involved in the regulation of food intake (7, 8) and presumed target site for the peripheral ghrelin (9). Neuropeptide Y (NPY) neurons have been designated as the primary targets of the peripheral ghrelin (7, 10-12) and most of the ghrelin actions in ARC are realized via agouti-related peptide(AGRP)/NPY pathway (13, 14). However, ghrelin may interact with a number of other neurons, including proopiomelanocortin/cocaine- and amphetamine-regulated transcript (POMC/CART), and corticotropin-releasing hormone (CRH) (12, 15). In addition, ghrelin-containing neurons have been also demonstrated in ARC (12, 16).
Peripheral administration of ghrelin (17-21) and GHS-R agonists (8, 22-24) induce Fos expression, a marker of neuronal activation, in ARC neurons. Fos expression in ARC neurons has been also demonstrated after intracerebroventricular (i.c.v.) injection (25-28) and intra-PVN infusion (29) of ghrelin. However, there is only a little information available regarding the neurochemical identity of ARC neuronal phenotypes influenced by the peripheral ghrelin.
Catecholamines also participate in the food intake regulation (30, 31) and tyrosine hydroxylase (TH) neurons in PVN are active components of the neuronal circuits that control the brown adipose tissue function and energy metabolism (32). In the ventral tegmental area (VTA), ghrelin signaling specifically in catecholaminergic neurons not only mediates certain of ghrelin’s orexigenic, antidepressant-like, and food-reward behavioral effects, but also is sufficient to mediate stress-induced food-reward behavior (33, 34). In ARC, the TH neurons are known targets of the acute prolactin treatment (35). Partial activation of TH neurons in ARC has been also reported after i.c.v. injection of GHS-R agonist, growth hormone-releasing peptide-6 (22). Moreover, the GHS-R and TH coexpressions in ARC neurons were demonstrated (36) indicating that TH-positive neurons possessing GHS-R might be responsible for the feeding effect of ghrelin/GHS (37). However, there are no literature data available dealing with the activity of TH-producing neurons in ARC in response to stimulation or inhibition of GHS-R. The aim of the present study was to find out whether TH cells located in ARC might also be involved in the peripheral ghrelin response. Therefore, the effect of a single orexigenic dose of GHS-R agonist itself or in combination with GHS-R antagonist on the activity of the ARC TH-containing neurons was investigated in normal and high fat diet C57BL/6 male mice.
MATERIALS AND METHODS
Experimental animals
Inbred C57BL/6 male mice (AnLab, Prague, Czech Republic) were used. They were housed individually in a room with 23°C temperature, 55% humidity, and daily light-dark cycle (light from 06:00 a.m. to 06:00 p.m.). The standard diet (SD) consisted of 25%, 9%, and 66% calories as protein, fat, and carbohydrate, respectively (Mlyn Kocanda, Jesenice, Czech Republic). The high fat diet (HFD) consisted of 13%, 60%, and 27% calories as protein, fat, and carbohydrate, respectively. The SD or HFD was served for 14 weeks (up to 22 weeks of age). All experiments were performed between 08:00 and 12:00 a.m. and have been approved by the Committee for experiments with laboratory animals of the Academy of Sciences of the Czech Republic following the Ethical Guidelines for Animal Experiments of the Czech Republic (law No. 246/1992).
Synthesis of peptides
[Dpr(N-octanoyl)3] ghrelin (Dpr3ghrelin, Gly-Ser-Dpr(N-octanoyl)-Phe-Leu-Ser-Pro-Glu-His-Gln-His-Gln-Lys-Ala-Gln-Gln-Arg-Lys-Glu-Ser-Lys-Lys-Pro-Pro-Ala-Lys-Leu-Gln-Pro-Arg, Dpr - diaminopropionic acid) (38) and [DLys3]GHRP-6 (His-DTrp-DLys-Trp-DPhe-Lys-NH2) were assembled in the Institute of Organic Chemistry and Biochemistry (Prague) in a solid-phase ABI433A synthesizer (Applied Biosystems, Foster City, CA, USA) using Fmoc protocol described elsewhere (39).
Administration of Dpr3ghrelin (DPG) and [DLys3]GHRP-6 (DLG)
The mice were kept in separate cages with free access to water and appropriate food pellets for one week. For evaluation of the orexigenic activity of peptides, the mice had free access to food before starting the experiment. Experiment started at 8:00 a.m. and the mice were injected subcutaneously (s.c.) with 0.2 ml of saline or tested compounds (dissolved in saline), i.e. ghrelin agonist Dpr3ghrelin in a dose of 5 mg/kg (DPG5) or 10 mg/kg (DPG10) or ghrelin antagonist [DLys3]GHRP-6 in a dose of 10 mg/kg (DLG). The saline (SAL-SAL) or tested compounds were administered alone (SAL-DPG5, SAL-DPG10, DLG10-SAL), or in combination with the antagonist (DLG10-DPG5, DLG10-DPG10) injected 10 min prior the agonist treatment (n=5/group). Fifteen minutes after the agonist injection, the mice received pre-weighed food pellets. Food intake was monitored for 6 hours and then the pellets were weighed in 30 min intervals and replaced with fresh ones. Cumulative food intake was registered.
Fos/TH immunohistochemistry
For Fos/TH immunohistochemistry, mice fed with SD (n=30, m=37.09±0.66 g) and HFD (n=30, m=49.06±0.44 g) were used. The mice were divided into 6 groups (n=5/group) and treated with: a) SAL-SAL, b) SAL-DPG5, c) SAL-DPG10, d) DLG10-SAL, e) DLG10-DPG5, f) DLG10-DPG10. All substances were dissolved in saline and administered s.c. in a volume of 0.2 ml. After the first injection, the food pellets were removed. SAL or DLG pretreatment was 10 min later followed with SAL or DPG treatment. Ninety minutes after the second injection, the mice were deeply anesthetized with sodium pentobarbital (50 mg/kg, i.p.) and perfused transcardially with 100 ml of ice-cold fixative containing 4% paraformaldehyde in 0.1 M phosphate buffer (PB, pH 7.4). The brains were postfixed in fresh fixative at 4°C overnight and immersed in 20% sucrose in 0.1 M PB for 48 hours. Finally, the brains were frozen and cut into coronal sections of 30 µm thickness at –22°C in a cryostat CM1950 (Leica Microsystems GmbH, Germany). Two parallel sets of free floating sections were collected in cold 0.1 M PB and stored in a cryoprotective solution until used.
Free-floating sections were washed in cold 0.1 M PB and incubated with 3% H2O2 in 0.1 M PB (Sigma-Aldrich, Germany) for 40 min at room temperature (RT). After several washings in 0.1 M PB, the sections were incubated with rabbit polyclonal Fos antiserum diluted 1:2000 in 0.1 M PB, containing 4% normal goat serum (NGS, Gibco, Grand Island, NY, USA), 0.5% Triton X-100 (Sigma-Aldrich, Germany), and 0.1% sodium azide (Sigma Chemical Ltd., St. Louis, MO, USA) for 48 hours at 4°C. After several rinsings in 0.1 M PB, the sections were incubated with biotinylated goat anti-rabbit IgG (1:500, VectorStain Elite ABC Kit, Vector Lab., Burlingame, CA, USA) diluted in 0.1 M PB containing 4% NGS and 1% Triton X-100 for 90 min at RT. Next PB rinsings were followed by incubation with avidin-biotin-peroxidase complex (1:250, VectorStain Elite ABC, Vector lab., Burlingame, CA) diluted in 0.1 M PB containing 1% Triton X-100 for 90 min at RT. After washing in 0.05 M sodium acetate buffer (SAB, pH 6.0), Fos reaction was developed (6–10 min) in 0.05 M SAB containing 0.0266% 3,3’-diaminobenzidine tetrahydrochloride (DAB, Sigma), 2.5% nickel ammonium sulfate (Sigma), and 0.0006% H2O2. Thereafter, the Fos-positive sections were incubated with mouse TH antiserum (Abcam, TH-100, 1:2000) for 48 hours at 4°C. TH was visualized by a single 0.0124% DAB in 0.05 M TRIS buffer (pH 7.4) by adding 0.00156% H2O2. The immunostaining was monitored under the light microscope. Finally, the sections were immersed into 1% gelatine dissolved in 0.0125 M SAB and mounted on glasses, air-dried, coverslipped with Permount (Sigma), and examined under Axio Imager 2 (Carl Zeiss) light microscope. Negative control of immunostaining, which did not show any antiserum immunolabeling, included substitution of the primary antisera with normal rabbit serum and sequential elimination of the primary and secondary antibodies from the staining procedure (40).
Statistical analysis
The cumulative food intake data were analyzed by repeated measures of ANOVA followed by Tukey´s post hoc test (Statistica 6.0 software) and presented as means ± S.E.M. The number of Fos, TH, and Fos/TH profiles was counted bilaterally (separately on each side) from 2–4 representative sections/animal. For the selection of ARC-containing sections (from bregma –1.58 mm to bregma –1.94 mm) Frankin and Paxinos (41) atlas of mice was used. The percentage (%) of labeled Fos/TH neurons was expressed unilaterally per section of each animal and calculated from formula: a) Fos/TH vs. single Fos (%)=100 × (number of Fos/TH neurons in selected nuclei per section/number of all Fos cells in selected nuclei per section), b) Fos/TH vs. total TH (%)=100 × (number of Fos/TH neurons in selected nuclei per section/number of all TH neurons in the selected nuclei per section). The data obtained were analyzed by two-way ANOVA followed by Tukey´s post hoc test (Statistica 6.0 software) and presented as means ± S.E.M. Differences were considered statistically significant at the p<0.05.
The Pearson’s correlation coefficient (r) and coefficient for determination (r2) were analyzed between the ratio of activated TH neurons to total Fos cells vs. the ratio of activated TH neurons to total TH neurons. The positive and negative r values indicated direct and indirect correlation between values, respectively (42). The r=0 means no correlation between variables, r<0.35 weak correlation, r=0.36 to 0.67 moderate correlation, r=0.68 to 0.89 strong correlation, and r>0.90 very strong correlation (42). The correlation percentage (CP) of the ratio of activated TH neurons to total Fos cells explained by concurrently variations in the ratio of activated TH neurons to total TH neurons was calculated from formula: CP (%)=100 × r2.
RESULTS
Food intake
Cumulative food intake was significantly influenced by applied diet (F=5.01698, p=0.000113) as well as the treatment alone (F=1.73553, p=0.004689) (Fig. 1).
In mice fed with SD, SAL-SAL treatment did not affect the food intake in any of the time intervals studied (Fig. 1). However, SAL-DPG10 administration significantly increased the food intake from 135 to 315 min in SD mice (Fig. 1). DLG-SAL treatment had no significant effect on food intake in comparison with SAL-SAL-treated SD mice (Fig. 1). DLG pretreatment significantly inhibited the stimulatory effect of DPG10 on the food intake from 135 to 225 min in SD mice (Fig. 1).
In HFD mice treated with SAL-SAL, food intake concurrently increased with the time and reached significance already at 45 min and between 135 and 315 min in comparison with the proper SD controls (Fig. 1). Administration of SAL-DPG5 or SAL-DPG10 had no effect on the food intake in comparison with SAL-SAL-treated ones in HFD mice (Fig. 1). In mice fed with HFD, the administration of DLG-SAL significantly suppressed the food intake from 135 to 315 min in comparison with SAL-SAL-treated mice (Fig. 1). Moreover, DLG-SAL treatment significantly suppressed the food intake in comparison with SAL-DPG5 (from 135 to 195 min and at 255 min) and SAL-DPG10 (at 255 min) in HFD mice (Fig. 1). In HFD mice, DLG-DPG10 treatment significantly affected the food intake at 135 min in comparison with SAL-SAL-treated ones (Fig. 1).
Fos expression in ARC
Activated cells were distributed over the entire area of ARC and were significantly influenced by applied diet (F1,47=17.6, p=0.000119) as well as treatment alone (F5,47=20.79, p<0.000001) (Fig. 2).
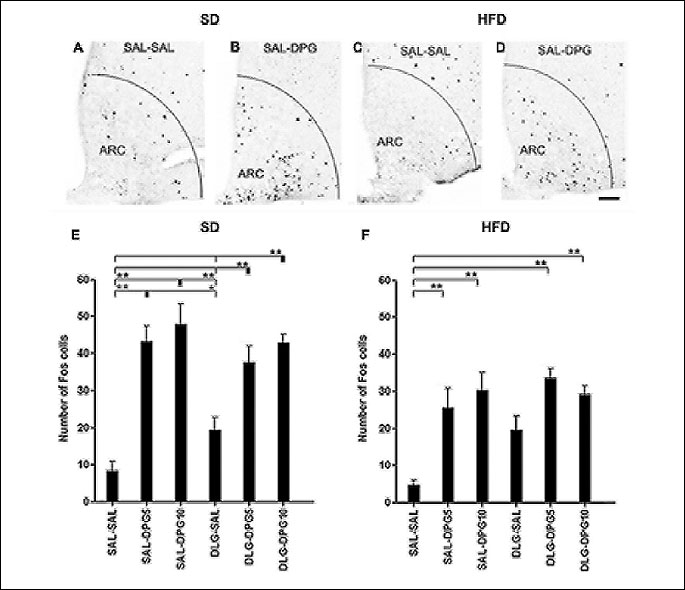
(** p<0.01, * p<0.05). Scale bar = 15 µm.
SAL-SAL treatment activated only a few neurons in ARC in both SD and HFD mice (Fig. 2A, 2C, 2E, 2F). On the other hand, treatment with both doses of ghrelin agonist (SAL-DPG5 and SAL-DPG10) significantly increased the number of Fos positive neurons in ARC of SD and HFD mice in comparison with their proper SAL-SAL controls (Fig. 2B, 2D, 2E, 2F). SAL-DPG5 and SAL-DPG10 treatments significantly increased the number of Fos positive neurons in ARC only in SD mice in comparison with DLG-SAL treated mice (Fig. 2E). Although administration of DLG-SAL also increased the expression of Fos positive profiles in ARC neurons, this rise was not significant in any of the diet groups in comparison with their proper SAL-SAL controls (Fig. 2E and 2F). In both diet groups, DPG5 and DPG10 treatments in combination with DLG pretreatment (DLG-DPG5 and DLG-DPG10) significantly increased the number of Fos protein positive neurons in ARC in comparison with the proper SAL-SAL-treated controls (Fig. 2E and 2F). Moreover, significant effect of DLG-DPG10 in comparison with DLG-SAL treated group was confirmed only in SD mice (Fig. 2E and 2F).
Fos-positive TH neurons vs. total number of Fos-positive cells in ARC
Fos/TH vs. total Fos immunopositive cells in ARC was significantly influenced by applied treatment (F5,47=35.17, p<0.000001) as well as diet × treatment (F5,47=7.13, p=0.000049) (Fig. 3).
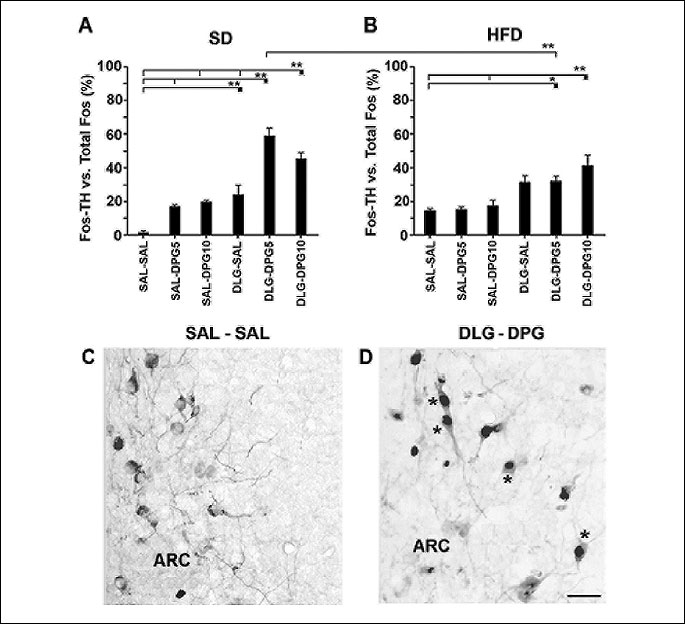
SAL-SAL treatment elicited only a few Fos/TH neurons in ARC in both diet groups (Fig. 3A and 3B). Although, SAL-DPG5 and SAL-DPG10 treatments increased the ratio of Fos/TH vs. total number of Fos in both diet groups, no significant differences were found between them or their proper SAL-SAL-treated mice (Fig. 3A and 3B). DLG-SAL treatment significantly increased the ratio of Fos/TH vs. total Fos cells only in SD mice in comparison with SAL-SAL-treated animals (Fig. 3A). On the other hand, significant increase in the ratio of Fos/TH vs. total Fos cells was found after DLG-DPG5 and DLG-DPG10 treatments in both diet groups in comparison with the proper SAL-SAL-treated ones (Fig. 3A-3D). In both diet groups, DLG-DPG10 treatment also significantly increased the ratio of Fos/TH vs. total Fos positive cells in comparison with their proper SAL-DPG10-treated groups (Fig. 3A and 3B). DLG-DPG5 treatment significantly influenced the ratio of Fos/TH vs. total Fos cells in SD mice in comparison with DLG-DPG5 treatment in HFD mice (Fig. 3A and 3B). In SD mice, DLG-DPG5 treatment significantly increased the ratio of Fos/TH vs. total Fos in comparison with SAL-DPG5 treatment alone (Fig. 3A). Moreover, in SD mice, DLG-DPG5 and DLG-DPG10 treatments significantly increased the ratio of Fos/TH vs. Fos in comparison with DLG-SAL treatment (Fig. 3A).
Fos-positive TH neurons vs. total number of TH neurons in ARC
The spatial distribution pattern of TH neurons in ARC was similar in each group of mice. The number of TH neurons in ARC (28.15±0.85) did not statistically differ between the individual groups of animals. On the other hand, statistical analysis confirmed the effect of applied diet (F1,47=30.88, p<0.000001) and treatment alone (F5,47=46.92, p<0.000001) as well as effect of diet x treatment (F5,47=5.96, p=0.00024) on the activity of TH neurons in relation to the total amount of TH neurons in the ARC (Fig. 4).
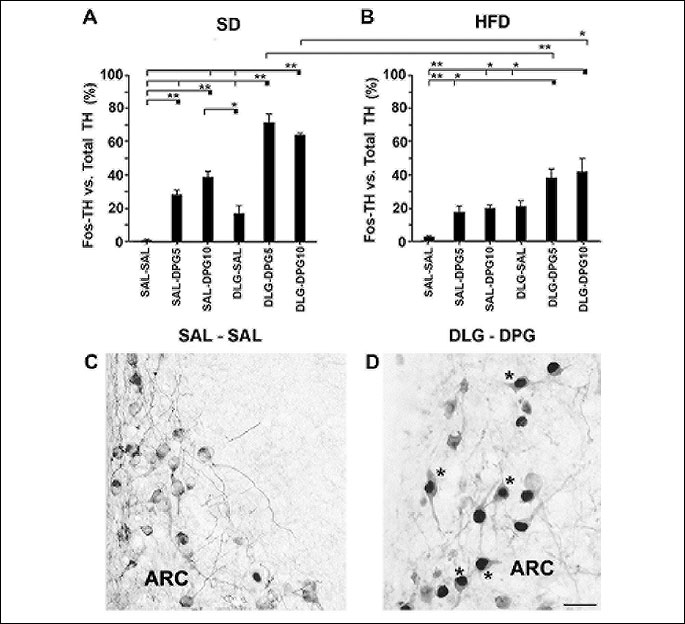
SAL-SAL treatment induced only a sporadic Fos expression in ARC TH neurons in both diet groups (Fig. 4A and 4B). In SD mice, SAL-DPG5 and SAL-DPG10 treatments significantly elevated the number of TH neurons in comparison with SAL-SAL-treated group (Fig. 4A). On the other hand, the effect of SAL-DPG5 vs. SAL-DPG10 and DLG-DPG5 vs. DLG-DPG10 on TH cells did not differ in any of the diet groups (Fig. 4A and 4B). Although DLG-SAL treatment induced Fos expression in TH neurons in both diet groups, no significant change was seen in the ratio of Fos/TH vs. total TH cells in comparison with the proper SAL-SAL-treated groups (Fig. 4A and 4B). Moreover, the effect of DLG-SAL, SAL-DPG5, and SAL-DPG10 treatments on the activation of TH neurons did not differ between the SD and HFD mice (Fig. 4A and 4B). DLG in combination with DPG5 or DPG10 treatment significantly activated TH neurons in both diet groups in comparison with SAL-SAL (Fig. 4A-4D) or the proper SAL-DPG5- and SAL-DPG10-treated groups (Fig. 4A and 4B). Moreover, DLG-DPG5 and DLG-DPG10 effect on TH neurons was significantly reduced in HFD mice in comparison with the same groups of SD mice (Fig. 4A and 4B). Although the stimulatory effect of DLG-DPG10 on the activation of TH neurons was significant in both diet groups in comparison with DLG-SAL treatment (Fig. 4A and 4B), the significant effect of DLG-DPG5 was confirmed only in comparison with DLG-SAL-treated SD mice (Fig. 4A). The stimulatory effect of SAL-DPG10 was significant only in SD mice in comparison with DLG-SAL treatment alone (Fig. 4A).
Fos/TH vs. total Fos and Fos/TH vs. total TH correlation in ARC
The statistical analysis revealed weak direct correlation as well as correlation percentage (CP) between the ratio of Fos/TH vs. total Fos and Fos/TH vs. total TH cells in the ARC after SAL-DPG5 and SAL-DPG10 treatments; moderate correlation after SAL-SAL, DLG-SAL, and DLG-DPG10 treatments; and strong correlation after DLG-DPG5 treatment (Table 1). On the other hand, strong correlation was found between the ratio of Fos/TH vs. total Fos and Fos/TH vs. total TH neurons in both diet groups (Table 1).
The statistical analysis showed very strong direct as well as CP correlations between the ratio of Fos/TH vs. total Fos cells and the ratio of Fos/TH vs. total TH cells in SAL-SAL- and DLG-SAL-treated SD mice (Table 1). In the same conditions, the HFD mice revealed only weak direct and moderate indirect correlations (Table 1). SAL-DPG10 treatment revealed moderate indirect correlation between the ratio of Fos/TH vs. total Fos cells and the ratio of Fos/TH vs. total TH cells in both diet groups (Table 1). The same effect of SAL-DPG5 treatment was only seen in SD mice (Table 1). DLG pretreatment in DPG5- and DPG10-treated mice increased the correlation between the ratio of Fos/TH to total Fos cells vs. the ratio of Fos/TH to total TH cells and reversed it into the direct correlation in comparison with DLG-SAL, SAL-DPG5 or SAL-DPG10 group in HFD mice (Table 1). In SD mice, DLG pretreatment of DPG5 mice did not influence the correlations between the ratio of Fos/TH to total Fos cells vs. the ratio of Fos/TH to total TH cells in comparison with SAL-DPG5-treated group (Table 1) but modify it in comparison with DLG-SAL group (Table 1). Besides, in SD mice DLG pretreatment weakened the correlation of the ratio Fos/TH to total Fos cells vs. the ratio of Fos/TH to total TH cells in DPG10 mice in comparison with DLG-SAL and SAL-DPG10 ones (Table 1).
DISCUSSION
The data of the present study clearly demonstrate that both doses of GHS-R agonist (DPG5 and DPG10) stimulated food intake concurrently with the rising time in SD but not HFD mice. On the other hand, GHS-R antagonist (DLG) suppressed the food intake in HFD mice as well as reduced the stimulatory effect of both doses of GHS-R agonist on the food intake in SD mice. This affirmed that both GHS-R agonist and antagonist doses used were assigned correctly in this study. Furthermore, both doses of GHS-R agonist stimulated single Fos expression in ARC neurons in both diet groups which was not abolished by GHS-R antagonist pretreatment. Moreover, both doses of GHS-R agonist significantly increased the activity of TH neurons in ARC only in SD mice. GHS-R antagonist significantly increased TH neurons activation after GHS-R agonist, however, this effect was less powerful in HFD mice.
The regulation of food intake is a complex and ARC plays a crucial role in the integration of the peripheral metabolic signals, including ghrelin. Ghrelin is the only peripheral orexigenic peptide known to date that has a central effect presumably mediated via ARC neurons (9). Systemic administration of ghrelin activates cells in ARC, whereas Fos protein presence in cell nuclei is an important indicator of this activation (17, 22). Circulating ghrelin has recently been implicated also in extra-homeostatic feeding, increasing food reward and food-motivated behavior. This neurocircuitry involves, in particular, the dopamine cells of the VTA that project to the nucleus accumbens (34). Activation of VTA area by peripheral ghrelin also partly influence the food intake. The present study was not aimed to evaluate this aspect of the treatments, however, this eventuality will be taken into account in further studies.
Previously we have also shown (23) that not only ghrelin but also a number of its synthetic analogs may significantly increase the number of Fos expressing cells in ARC in male C57BL/6 mice fed with SD. In the present study, both doses of GHS-R agonist stimulated Fos expression over the entire area of ARC in C57BL/6 male mice fed with SD and this effect was not influenced by pretreatment with GHS-R antagonist. In HFD mice, the stimulatory effect of GHS-R agonist alone or in combination with GHS-R antagonist pretreatment was less distinct on Fos expression in comparison with SD mice. However, these findings are surprising when their effect is compared with the food intake experiment where GHS-R antagonist suppressed the food intake in HFD mice and reduced the food intake stimulatory effect of both doses of GHS-R agonist in SD mice. Halem et al. (43) have also observed a paradoxical, i.e. stimulatory and inhibitory, effect of BIM-28163, an antagonist of the GHS-1a receptor, on Fos expression in two different hypothalamic areas. However, in contrast to our data, BIM-28163 has been shown to act as an agonist with regard to stimulating weight gain (43).
Other reasons of the paradoxical effect of GHS-1a receptor antagonist on Fos expression may lie in the fact that neurons located in different ARC areas are exposed to the ghrelin impact by different ways, i.e. not only involving GHS-R1a receptors (24). In addition, TH neurons located in different ARC areas may be under the effect of a spectrum of different regulatory neurotransmitters (44, 45). Cells in different location of ARC can be influenced differently: 1) Cells located in the ventromedial ARC area can be directly affected by circulating ghrelin or its agonists since this region has a weak blood-brain barrier (BBB) (46-49). 2) Activation of the cells in the dorsomedial ARC area might be affected by substances present in the cerebrospinal fluid (CSF) (50). However, for ghrelin, this is only a little presumable way, since ghrelin levels in CSF are 1000-fold lower than in the blood (51); and 3) Activation of the cells in the ventrolateral ARC area may probably be only realized via interneuronal connections, because horseradish peroxidase (HRP) injected into the ventromedial nucleus may diffuse into adjacent areas except ARC, indicating that ARC milieu is closed to all adjacent neural structures (49). Although it has been shown that peripheral and central administration of [DLys3]GHRP-6 exhibits similar effect on the food intake regulation (52), it is not clear from the literature available whether [DLys3]GHRP-6 may cross the BBB. Finally, activation of ARC TH neurons by ghrelin might be realized indirectly from the intrinsic and extrinsic sources, i.e., rich network of interneuronal connections of ghrelin and NPY producing neurons in the ventromedial ARC and noradrenergic pathway ascending from the caudal brainstem, respectively (53).
There are not many studies available demonstrating an extensive activation of TH neurons in the ARC (22). In our study, we found that both doses of GHS-R agonist significantly activated TH neurons in ARC of SD mice, mainly in its dorsomedial part, while no significant effect of GHS-R agonist was observed in HFD mice. Since TH neurons in ARC dorsomedial part are involved in the regulation of prolactin (PRL) release, our data are in the line of findings that both systemic and central administration of ghrelin may significantly inhibit PRL secretion in rats (54). In our study, the direct relationship between the ratio of Fos/TH vs. total Fos and Fos/TH vs. total TH neurons under basal conditions in SD mice as well as reduced effect of ghrelin agonist on the activity of TH neurons in HFD mice may indicate induction of HFD-related abnormalities in ARC neurons involved in the regulation of feeding and PRL secretion.
It is undisputable that peripheral ghrelin increases feeding by activating NPY neurons in ARC (55). In the present study, activation of ARC TH neurons was observed after both doses of GHS-R agonist, whereas the response was more distinct in SD than HFD animals. This difference might be partially described to decreasing expression of hypothalamic GHS-R in HFD animals which may reflect lower effect of ghrelin in fat and satiated animals (26, 28). Appositions between TH and NPY neuronal systems in the ARC (56) and TH mRNA increase in ARC neurons after i.c.v. injection of NPY (57), strongly suggests that peripheral ghrelin might indirectly regulate the activity of ARC TH neurons via stimulation of AGRP/NPY neurons. Indirect activation by ghrelin has also been suggested by Cabral et al. (58), who have demonstrated that ghrelin is able to activate CRH neurons of the PVN regardless the lack of detectable CRH and GHS-R co-expressing neurons.
Other candidates, like serotonin and galanin, have close anatomical relationship with TH neurons. It has been shown that ghrelin is able to significantly inhibit the 5-HT release from the hippocampal slices (59), whereas 5-HT is capable to influence TH activity and TH mRNA levels in ARC dopamine neurons (60, 61). Direct appositions between serotoninergic (5-HT) axonal varicosities and dopaminergic nerve cell bodies in the ARC (62) indicate that circulating ghrelin might directly influence the 5-HT/TH functional interrelationship in the ARC. However, fenfluramine (a drug stimulating 5-HT release and inhibiting 5-HT reuptake) treatment has been shown to be able significantly increase the expression of hypothalamic POMC and CART but not NPY, AGRP, and ghrelin genes in the hypothalamus, indicating that a negative feedback system between the brain 5-HT components and plasma active ghrelin levels may exist (63). Lopez et al. (64) have demonstrated by electron microscopic immunocytochemistry existence of a local galaninergic circuit within the ARC. Hrabovszky and Liposits (65) have revealed synaptic connections between galaninergic (GAL) axons and TH neurons in the ARC of the rat hypothalamus, indicating a role for GAL as a possible synaptic modulator of the ARC TH neurons. Whether ghrelin might be involved in this GAL-TH circuit is not known.
In contrary to our expectation, GHS-R antagonist itself was not inhibitory and even enhanced the stimulatory effect of both doses of GHS-R agonist on TH neurons in SD mice. However, it has been shown that the effect of ghrelin was completely abolished by its receptor antagonist [DLys3]GHRP-6 pretreatment in the case of the hypothalamic glucose responding neurons (66). Besides, we have previously shown that long term administration of [DLys3]GHRP-6 attenuates the food intake and body weight in HFD mice with DIO (67). In contrast to ARC, the functional role of TH neurons is clearly delineated in the PVN, where TH expression is under the control of ARC/NPY-PVN pathway and its activation is critical for the control of the sympathetic outflow, brown adipose tissue function, and energy metabolism (32).
In summary, this is the first study demonstrating response of local ARC TH neurons to peripherally applied GHS-R agonist and antagonist. The present data point out that the response of TH neurons to GHS-R agonist and antagonist is different in normal and HFD mice and extend our knowledge about the further ARC neuronal phenotype responding to peripheral ghrelin. To bring insight into the understanding of the functional significance of the activated TH neurons in ARC, in the context of the ghrelin peripheral increase, further studies are required.
Acknowledgements: The authors would like to thank Dr. Jens Mikkelsen (Denmark) for kind providing Fos antibody, M. Blechova (IOCB, Prague) for peptide synthesis, and H. Vysusilova for excellent technical assistance. This research was supported by grants RVO:61388963 (Academy of Sciences of the Czech Republic) and 560112 (M. Holubova) (Grant Agency of Charles University), the “BrainCentrum” grant of the Centrum of Excellence of the Slovak Academy of Sciences (Bratislava, Slovakia), and the National Reference Laboratory for Pesticide of the University of Veterinary Medicine and Pharmacy (Kosice, Slovakia).
Conflicts of interest: None declared.
REFERENCES
- Kojima M, Hosoda H, Date Y, Nakazato M, Matsuo H, Kangawa K. Ghrelin is a growth-hormone-releasing acylated peptide from stomach. Nature 1999; 402: 656-660.
- Wren AM, Seal LJ, Cohen MA, et al. Ghrelin enhances appetite and increases food intake in humans. J Clin Endocrinol Metab 2001; 86: 5992-5995.
- Rak-Mardyla A. Ghrelin role in hypothalamus-pituitary-ovarian axis. J Physiol Pharmacol 2013; 64: 695-704.
- Szlachcic A, Majka J, Strzalka M, et al. Experimental healing of preexisting gastric ulcers induced by hormones controlling food intake ghrelin, orexin-A and nesfatin-1 is impaired under diabetic conditions. A key to understanding the diabetic gastropathy? J Physiol Pharmacol 2013; 64: 625-637.
- Harrold JA, Dovey T, Cai XJ, Halford JC, Pinkney J. Autoradiographic analysis of ghrelin receptors in the rat hypothalamus. Brain Res 2008; 1196: 59-64.
- Ferrini F, Salio C, Lossi L, Merighi A. Ghrelin in central neurons. Curr Neuropharmacol 2009; 7: 37-49.
- Horvath TL, Diano S, Sotonyi P, Heiman M, Tschop M. Minireview: Ghrelin and the regulation of energy balance -a hypothalamic perspective. Endocrinology 2001; 142: 4163-4169.
- Hewson AK, Tung LY, Connell DW, Tookman L, Dickson SL. The rat arcuate nucleus integrates peripheral signals provided by leptin, insulin, and a ghrelin mimetic. Diabetes 2002; 51: 3412-3419.
- Becskei C, Bilik KU, Klussmann S, Jarosch F, Lutz TA, Riediger T. The anti-ghrelin Spiegelmer NOX-B11-3 blocks ghrelin- but not fasting-induced neuronal activation in the hypothalamic arcuate nucleus. J Neuroendocrinol 2008; 20: 85-92.
- Kamegai J, Tamura H, Shimizu T, Ishii S, Sugihara H, Wakabayashi I. Chronic central infusion of ghrelin increases hypothalamic neuropeptide Y and agouti-related protein mRNA levels and body weight in rats. Diabetes 2001; 50: 2438-2443.
- Wang L, Saint-Pierre DH, Tache Y. Peripheral ghrelin selectively increases Fos expression in neuropeptide Y - synthesizing neurons in mouse hypothalamic arcuate nucleus. Neurosci Lett 2002; 325: 47-51.
- Cowley MA, Smith RG, Diano S, et al. The distribution and mechanism of action of ghrelin in the CNS demonstrates a novel hypothalamic circuit regulating energy homeostasis. Neuron 2003; 37: 649-661.
- Tschop M, Statnick MA, Suter TM, Heiman ML. GH-releasing peptide-2 increases fat mass in mice lacking NPY: indication for a crucial mediating role of hypothalamic agouti-related protein. Endocrinology 2002; 143: 558-568.
- Guan JL, Wang QP, Kageyama H, et al. Synaptic interactions between ghrelin- and neuropeptide Y-containing neurons in the rat arcuate nucleus. Peptides 2003; 24: 1921-1928.
- Kubale V. Appetite regulation and obesity: emphasis on ghrelin and ghrelin receptor. Slov Vet Res 2011; 48: 69-81.
- Lu S, Guan JL,Wang QP, et al. Immunocytochemical observation of ghrelin-containing neurons in the rat arcuate nucleus. Neurosci Lett 2002; 321: 157-160.
- Hewson AK, Dickson SL. Systemic administration of ghrelin induces Fos and Egr-1 proteins in the hypothalamic arcuate nucleus of fasted and fed rats. J Neuroendocrinol 2000; 12: 1047-1049.
- Ruter J, Kobelt P, Tebbe JJ, et al. Intraperitoneal injection of ghrelin induces Fos expression in the paraventricular nucleus of the hypothalamus in rats. Brain Res 2003; 991: 26-33.
- Takayama K, Johno Y, Hayashi K, Yakabi K, Tanaka T, Ro S. Expression of c-Fos protein in the brain after intravenous injection of ghrelin in rats. Neurosci Lett 2007; 417: 292-296.
- Kobelt P, Tebbe JJ, Tjandra I, et al. CCK inhibits the orexigenic effect of peripheral ghrelin. Am J Physiol Regul Integr Comp Physiol 2005; 288: R751-R758.
- Kobelt P, Wisser AS, Stengel A, et al. Peripheral injection of ghrelin induces Fos expression in the dorsomedial hypothalamic nucleus in rats Brain Res 2008; 1204: 77-86.
- Dickson SL, Luckman SM. Induction of c-fos messenger ribonucleic acid in neuropeptide Y and growth hormone (GH)-releasing factor neurons in the rat arcuate nucleus following systemic injection of the GH secretagogue, GH-releasing peptide-6. Endocrinology 1997; 138: 771-777.
- Pirnik Z, Bundzikova J, Holubova M, et al. Ghrelin agonists impact on Fos protein expression in brain areas related to food intake regulation in male C57BL/6 mice. Neurochem Int 2011; 59: 889-895.
- Hassouna R, Labarthe A, Zizzari P, et al. Actions of agonists and antagonists of the ghrelin/GHS-R pathway on GH secretion, appetite, and cFos activity. Front Endocrinol 2013; 4: 25.
- Lawrence CB, Snape AC, Baudoin FM, Luckman SM. Acute central ghrelin and GH secretagogues induce feeding and activate brain appetite centers. Endocrinology 2002; 143: 155-162.
- Scott V, McDade DM, Luckman SM. Rapid changes in the sensitivity of arcuate nucleus neurons to central ghrelin in relation to feeding status. Physiol Behav 2007; 90: 180-185.
- Faulconbridge LF, Grill HJ, Kaplan M, Daniels D. Caudal brainstem delivery of ghrelin induces fos expression in the nucleus of the solitary tract, but not in the arcuate or paraventricular nuclei of the hypothalamus. Brain Res 2008; 1218: 151-157.
- Briggs DI, Enriori PJ, Lemus MB, Cowley MA, Andrews ZB. Diet-induced obesity causes ghrelin resistance in arcuate NPY/AgRP neurons. Endocrinology 2010; 151: 4745-4755.
- Olszewski PK, Grace MK, Billington CJ, Levine AS. Hypothalamic paraventricular injections of ghrelin: effect on feeding and c-Fos immunoreactivity. Peptides 2003; 24: 919-923.
- Friedman E, Starr N, Gershon S. Catecholamine synthesis and the regulation of food intake in the rat. Life Sci 1973; 12: 317-326.
- Schwartz MW, Woods SC, Porte D, Jr, Seeley RJ, Baskin DG. Central nervous system control of food intake. Nature 2000; 404: 661-671.
- Shi YC, Lau J, Lin Z, et al. Arcuate NPY controls sympathetic output and BAT function via a relay of tyrosine hydroxylase neurons in the PVN. Cell Metab 2013; 17: 236-248.
- Chuang JC, Perello M, Sakata I, et al. Ghrelin mediates stress-induced food-reward behavior in mice. J Clin Invest 2011; 121: 2684-2692.
- Skibicka KP, Hansson C, Alvarez-Crespo M, Friberg PA, Dickson SL. Ghrelin directly targets the ventral tegmental area to increase food motivation. Neuroscience 2011; 180: 129-137.
- Cave BJ, Wakerley JB, Luckman SM, Tortonese DJ. Hypothalamic targets for prolactin: assessment of c-Fos induction in tyrosine hydroxylase- and proopiomelanocortin-containing neurones in the rat arcuate nucleus following acute central prolactin administration. Neuroendocrinology 2001; 74: 386-395.
- Zigman JM, Jones JE, Lee CE, Saper CB, Elmquist JK. Expression of ghrelin receptor mRNA in the rat and the mouse brain. J Comp Neurol 2006; 494: 528-548.
- Shuto Y, Shibasaki T, Otagiri A, et al. Hypothalamic growth hormone secretagogue receptor regulates growth hormone secretion, feeding, and adiposity. J Clin Invest 2002; 109: 1429-1436.
- Bednarek MA, Feighner SD, Pong SS, et al. Structure-function studies on the new growth hormone-releasing peptide, ghrelin: minimal sequence of ghrelin necessary for activation of growth hormone secretagogue receptor 1a. J Med Chem 2000; 43: 4370-4376.
- Maletinska L, Pychova M, Holubova M, et al. Characterization of new stable ghrelin analogs with prolonged orexigenic potency. J Pharmacol Exp Ther 2012; 340: 781-786.
- Maletinska L, Maixnerova J, Matyskova R, et al. Synergistic effect of CART (cocaine- and amphetamine-regulated transcript) peptide and cholecystokinin on food intake regulation in lean mice. BMC Neurosci 2008; 9: 101.
- Frankin K, Paxinos TG. The Mouse Brain in Stereotaxic Coordinates. New York, Academic Press, 1997.
- Taylor R. Interpretation of the correlation coefficient: a basic review. J Diagn Med Sonogr 1990; 6: 35-39.
- Halem HA, Taylor JE, Dong JZ, et al. A novel growth hormone secretagogue-1a receptor antagonist that blocks ghrelin-induced growth hormone secretion but induces increased body weight gain. Neuroendocrinology 2005; 81: 339-349.
- Lin S, Boey D, Lee N, Schwarzer C, Sainsbury A, Herzog H. Distribution of prodynorphin mRNA and its interaction with the NPY system in the mouse brain. Neuropeptides 2006; 40: 115-123.
- Fry M, Ferguson AV. Ghrelin: central nervous system sites of action in regulation of energy balance. Int J Pept 2010; 2010: pii: 616757. doi: 10.1155/2010/616757.
- Ambach G, Palkovits M, Szentagothai J. Blood supply of the rat hypothalamus. IV. Retrochiasmatic area, median eminence, arcuate nucleus. Acta Morphol Acad Sci Hung 1976; 24: 93-119.
- Peruzzo B, Pastor FE, Blazquez JL, et al. A second look at the barriers of the medial basal hypothalamus. Exp Brain Res 2000; 132: 10-26.
- Norsted E, Gomuc B, Meister B. Protein components of the blood-brain barrier (BBB) in the mediobasal hypothalamus. J Chem Neuroanat 2008; 36: 107-121.
- Rodriguez EM, Blazquez JL, Guerra M. The design of barriers in the hypothalamus allows the median eminence and the arcuate nucleus to enjoy private milieus: the former opens to the portal blood and the latter to the cerebrospinal fluid. Peptides 2010; 31: 757-776.
- Vigh B, Manzano e Silva MJ, Frank CL, et al. The system of cerebrospinal fluid-contacting neurons. Its supposed role in the nonsynaptic signal transmission of the brain. Histol Histopathol 2004; 19: 607-628.
- Grouselle D, Chaillou E, Caraty A, et al. Pulsatile cerebrospinal fluid and plasma ghrelin in relation to growth hormone secretion and food intake in the sheep. J Neuroendocrinol 2008; 20: 1138-1146.
- Asakawa A, Inui A, Kaga T, et al. Antagonism of ghrelin receptor reduces food intake and body weight gain in mice. Gut 2003; 52: 947-952.
- Date Y, Shimbara T, Koda S, et al. Peripheral ghrelin transmits orexigenic signals through the noradrenergic pathway from the hindbrain to the hypothalamus. Cell Metab 2006; 4: 323-331.
- Tena-Sempere M, Aguilar E, Fernandez-Fernandez R, Pinilla L. Ghrelin inhibits prolactin secretion in prepubertal rats. Neuroendocrinology 2004; 79: 133-141.
- Kohno D, Gao HZ, Muroya S, Kikuyama S, Yada T. Ghrelin directly interacts with neuropeptide-Y-containing neurons in the rat arcuate nucleus: Ca2+ signaling via protein kinase A and N-type channel-dependent mechanisms and cross-talk with leptin and orexin. Diabetes 2003; 52: 948-956.
- Guy J, Pelletier G. Neuronal interactions between neuropeptide Y (NPY) and catecholaminergic systems in the rat arcuate nucleus as shown by dual immunocytochemistry. Peptides 1988; 9: 567-570.
- Hong M, Li S, Pelletier G. Role of neuropeptide Y in the regulation of tyrosine hydroxylase messenger ribonucleic acid levels in the male rat arcuate nucleus as evaluated by in situ hybridization. J Neuroendocrinol 1995; 7: 25-28.
- Cabral A, Suescun O, Zigman JM, Perello M. Ghrelin indirectly activates hypophysiotropic CRF neurons in rodents. PLoS ONE 2012; 7: e3146.
- Ghersi MS, Casas SM, Escudero C, et al. Ghrelin inhibited serotonin release from hippocampal slices. Peptides 2011; 32: 2367-2371.
- MohanKumar PS, MohanKumar SM, Quadri SK, Voogt JL. Responsiveness of tuberoinfundibular dopaminergic neurons to 5-hydroxytryptophan: effects of aging. Endocrine 1998; 9: 33-37.
- Mathiasen JR, Arbogast LA, Voogt JL. Central administration of serotonin decreases tyrosine hydroxylase catalytic activity and messenger ribonucleic acid signal levels in the hypothalamus of female rats. J Neuroendocrinol 1992; 4: 631-639.
- Bosler O, Joh TH, Beaudet A. Ultrastructural relationships between serotonin and dopamine neurons in the rat arcuate nucleus and medial zona incerta: a combined radioautographic and immunocytochemical study. Neurosci Lett 1984; 48: 279-285.
- Nonogaki K, Ohashi-Nozue K, Oka YA. Negative feedback system between brain serotonin systems and plasma active ghrelin levels in mice. Biochem Biophys Res Commun 2006; 341: 703-707.
- Lopez FJ, Liposits Zs, Merchenthaler I. Evidence for a negative ultrashort loop feedback regulating galanin release from the arcuate nucleus-median eminence functional unit. Endocrinology 1992; 130: 1499-1507.
- Hrabovszky E, Liposits Z. Galanin-containing axons synapse on tyrosine hydroxylase-immunoreactive neurons in the hypothalamic arcuate nucleus of the rat. Brain Res 1994; 652: 49-55.
- Chen X, Ge YL, Jiang ZY, Liu CQ, Depoortere I, Peeter TL. Effects of ghrelin on hypothalamic glucose responding neurons in rats. Brain Res 2005; 1055: 131-136.
- Maletinska L, Matyskova R, Maixnerova J, et al. The peptidic GHS-R antagonist [D-Lys(3)]GHRP-6 markedly improves adiposity and related metabolic abnormalities in a mouse model of postmenopausal obesity. Mol Cell Endocrinol 2011; 343: 55-62.
A c c e p t e d : May 27, 2014