MORPHOMETRIC ANALYSIS OF MUSCLE FIBRE TYPES IN RAT LOCOMOTOR AND POSTURAL SKELETAL MUSCLES IN DIFFERENT STAGES OF CHRONIC KIDNEY DISEASE
INTRODUCTION
Patients with chronic kidney disease (CKD), both in predialytic stages as well as during renal replacement therapy, suffer from a constellation of skeletal muscle structure and function abnormalities described under the term of uremic myopathy. This syndrome manifests as weakness, reduced exercise capacity and reduced skeletal muscle mass (wasting) (1). Uremic myopathy develops when glomerular filtration rates decrease, typically below 25 ml/min (2). There are two different patterns of muscle weakness in CKD patients - one affecting predominantly distal muscles and associated with neuropathy, and the other affecting predominantly proximal muscles (3). The precise mechanisms underlying the development of uremic myopathy remain unclear and seem to be multifactorial. Reduction in skeletal muscle mass in CKD reflects systemic deficits of protein and is a component of the protein-energy wasting syndrome (PEW). PEW is characterized by reduced circulating body proteins, reduced body mass and reduced skeletal muscle mass (muscle wasting or sarcopoenia) (4) and is recognised in about 18–75% of dialysis patients (5). The Modification of Diet in Renal Disease (MDRD) study indicated that the amount of protein and dietary calories, as well as the concentration of albumin in serum and anthropometric nutritional parameters, progressively decrease with a decrease in GFR in pre-dialysis CKD patients (6). Regulation of muscle protein balance in CKD is complex and involves several mechanisms. The ATP-dependent ubiquitin-proteasome proteolysis is singled out as the major cause of increased skeletal muscle degradation in CKD. Inflammation and metabolic acidosis play a major role in activating the ubiquitin-proteasome system (UPS) (7). The mechanism linking inflammation with PEW in the course of CKD is decreased appetite and increased protein catabolism under the influence of inflammatory cytokines. Causes of inflammation in CKD include, among others, an accumulation of proinflammatory compounds such as advanced glycation end products (AGEs), reduced antioxidant activity and increased oxidative stress (8). AGEs begin to accumulate when GFR falls within the 40–80 ml/min range (9). Low-grade inflammation is common in CKD, even in its early stages, as is manifested by increased circulating levels of CRP, IL-6 and tumour necrosis factor-alpha (TNF-α) (10). TNF-α escalates catabolic processes, thus activating the UPS and resulting in elevated degradation of proteins in skeletal muscles. Moreover, it interferes with the differentiation and reparation of damaged muscles and leads to the development of insulin resistance and a decrease in appetite. The concentration of TNF-α in the serum increases along with the deterioration of kidney function and correlates with increased death rate. High levels of acute phase proteins lead to the loss of muscle mass and reduced concentration of albumin, prealbumin and transferrin in serum (10). Through the activation of UPS, metabolic acidosis results in the glucocorticoid-mediated mechanism of skeletal muscle protein degradation and muscle fibre atrophy (7). Moreover, it induces resistance to anabolic hormones, such as the growth hormone, the insulin-like growth factor (IGF-1) and insulin (11). Taniyama et al. proved that angiotensin II, too, through the activation of NADPH oxidase, intensifies oxidative stress in the vessel wall, causing a defect in the insulin receptor substrate-1 (IRS-1) and the development of insulin resistance (12, 13). Other factors considered in the pathogenesis of uremic myopathy include decreased physical activity (immobilisation), depletion of amino-acids resulting from low-protein diets (14), vitamin D deficiency (15), hyperparathyroidism (16), loss of capillaries in microcirculation (17), as well as disrupted function of mitochondria (18) and elevated resting energy expenditure (19).
Skeletal muscle atrophy is generally cited in reviews on the influences of chronic renal failure on skeletal muscle morphometry (20). However, reports in the literature provide controversial findings. Studies performed on the locomotor muscles of haemodialised patients revealed atrophy of type II fibres (21), coexistence of atrophy in type II fibres with hypertrophy in type I fibres (22), as well as in larger cross-section areas of all muscle fibre types (23). Only two studies were performed on pre-dialysis patients, showing a greater degree of atrophy in type II than in type I fibres both in locomotor (24) and non-locomotor muscles (25).
The purpose of the present study was to characterize the degree of abnormalities found in two functionally different skeletal muscles: the gastrocnemius muscle (locomotor, flexor) and the longissimus thoracis muscle (non-locomotor, extensor) together with an evaluation of metabolic disturbances and nutritional parameters of rats with different stages of experimental CKD.
MATERIALS AND METHODS
Animal model
All procedures were carried out in accordance with the guidelines set by the Local Institutional Animal Care and Use Committees. Male Wistar rats weighing 339±42 g at the start of the experiment were used in the present study. They were housed individually in a temperature- and humidity-controlled environment, under a 12/12 h light/dark cycle. Rats received standard rat chow (Agropol, Motycz, Poland, values per 100 g: energy 262.7 kcal/1100kJ, protein content 16%, lysine 0.8%, methionine + cysteine 0.5%, tryptophan 0.15%, fat 2.8%, ash 7.0%, fibre 5.0%, sodium 0.22%, calcium 1.1%, phosphorus 0.7%) and tap water ad libitum. Experimental model of CKD was induced by one-step surgical resection of kidney mass (partial nephrectomy). This model of nephrectomy is well characterised in the literature and utilised for the study on muscle wasting in animals with renal failure (26). During surgical procedures, special care was taken to preserve the adrenal glands. All procedures were performed under total anaesthesia by intraperitoneal injection of sodium pentobarbital (~50 mg/kg).
In the CKD 1/2 group (n=12), the right nephrectomy was performed through a right flank incision. In the CKD 5/6 group (n=20), the right kidney and approximately 2/3 of the left kidney cortex were removed. The control group (CON), comprising 12 animals, was subjected to a sham operation, during which the kidneys were exposed, and then the renal capsule was removed. After four weeks of experiments, the animals were weighed, and then killed by blood removal from the abdominal aorta.
Biochemical test
The kidney function was assessed by measuring serum creatinine and blood urea nitrogen concentration, and calculating the endogenous creatinine clearance (CrCl). The CrCl was calculated from the following equation: CrCl (ml/min) = (urine creatinine [mg/dl] × urine volume [ml/24h]) / (serum creatinine [mg/dl] × 1,440 [min]). The concentration of blood urea nitrogen (BUN) and creatinine in serum and in 24-hour urine were measured using the Hitachi 912 automated clinical chemistry analyser (Roche Diagnostics Ltd., Lewes, UK). The serum haemoglobin concentration was measured using Roche reagents on the Hitachi 912 analyser. The homocysteine assay is a fluorescence polarisation immunoassay for the quantitative measurement of total L-homocysteine in serum on the AxSYM System (Abbott). Monocyte chemoattractant protein (MCP)-1 in serum was determined with a commercially available monoclonal antibody against rat MCP-1 (Pierce Endogen) using a Labsystem Multiscan RC analyser. Advanced glycation end products (AGEs) were measured by fluorescence spectroscopy. Serum samples were diluted 50-fold in PBS with pH=7.4. Fluorescence spectra (corrected for background) were recorded in a Fluoroscan Ascent FL (Labsystems) spectrometer at room temperature. When excitation was performed at 355 nm, the maximum emission wavelength was found at 460 nm and expressed in arbitrary units.
Histological analysis
Muscle samples were taken immediately after the blood removal. The medial head of the gastrocnemius muscle (MG) and the thoracic part (between second and eighth thoracic vertebras) of the longissimus dorsi muscle (ML) were collected for the study. Both muscle samples were taken from the same, right side of the animal and frozen in liquid nitrogen. Transverse serial sections (10 µm thick) were cut in a Leica cryostat at -20°C. In order to differentiate types of muscle fibres, a combined histochemical reaction was performed for myofibrillar ATPase and NADH-tetrazolium reductase (oxidative enzyme), with an adjustment of the preincubation fluid pH to 4.10, according to Ziegan's method, (27, 28). Based on the colour reaction performed, four fibre types were identified: type I (slow oxidative) -stained in black; type IIA (fast oxidative glycolytic) -stained in blue; type IID/X (fast oxidative glycolytic) -stained in light brown; and type IIB (fast glycolytic) - very light-coloured cells. The microscopic images were subsequently uploaded to a computer and analyzed with the use of the Leica Q 500 MC digital image analysis system. Classification of fibre types was conducted on the basis of a subjective evaluation of 10 muscle bundles chosen at random, featuring approximately 400 muscle fibres in each rat. The diameter of each muscle fibre type was evaluated by measuring the lesser diameter of fibres according to the Brooke method (29). The measurements were taken on the area of approximately 200 muscle fibres in each animal.
Statistical analysis
The obtained study results were processed statistically. The Shapiro-Wilk test was performed in order to inspect the compatibility of variable distribution with normal distribution. In the cases of normal distribution, univariate variance analysis and Duncan's post-hoc test were used to compare medians across groups. Levene's test was utilised to inspect the homogeneity of variance. When the distribution varied significantly from the normal distribution pattern, the significance of differences across groups was evaluated using the Kruskal-Wallis nonparametric test. Correlation between two parameters was evaluated with the Pearson linear correlation coefficient, with the level of significance established at p=0.05. Calculations were performed using Statistica software.
RESULTS
The results of biochemical tests, food consumption and body mass increase, expressed as median ±S.D., have been presented in Table 1.
Rat model of chronic kidney disease
To verify the development of CKD at the end of experiment, serum creatinine and BUN were measured and creatinine clearance was calculated. Serum creatinine concentration was significantly higher in CKD5/6 as compared with CON and CKD1/2. In the CKD1/2 group, there was a slight decrease in creatinine concentration as compared to CON, secondary to compensatory hyperfiltration. BUN level increased along with the degree of renal failure and was the highest in CDK5/6. Creatinine clearance dropped to 78% in CKD1/2 and 52% in CKD5/6 as compared to CON group (Table 1), and confirmed significant differences in renal function among the examined groups. These results pertaining to the experimental CKD model correspond with data presented by other authors (30).
Nutritional status analysis
The amount of consumed food and calories decreased along with the deterioration of kidney function, but the differences did not reach statistical significance, whereas the body weight gain was significantly lower with progression of renal failure. Only CKD5/6 group rats were characterised by significantly lower body mass at the end of the experiment when compared with the control group and the CKD1/2 group. Albumin concentration was lower (although not statistically significant) in both CKD groups when compared with the control group. Correlations were found between albumin concentration and creatinine (r= –0.49, p<0.05) and BUN (r= -0.64, p<0.01) in the CKD5/6 group. Significantly higher cholesterol concentration was observed in the CKD5/6 group in comparison with the other groups, while triglyceride concentration decreased significantly in both CKD groups in relation to the control group. Haemoglobin concentration decreased significantly with deteriorating kidney function.
Inflammatory state
Haptoglobin, MCP-1 and homocysteine increased significantly with the progression of CKD. Correlation was found between creatinine and MCP-1 in the CKD5/6 group (r=0.53, p<0.05). Levels of AGEs, a marker of oxidative stress, showed a tendency to be higher in CKD5/6 as compared with other groups.
Muscle fibre diameters
1. Gastrocnemius muscle
No significant differences in fibre diameters across groups were found in MG. A tendency for smaller diameters in all fibre types was observed in CKD5/6; however, in the CKD1/2 group a tendency for greater diameter of type I fibres than in controls and the CKD5/6 group was noted (Table 2).
2. Longissimus thoracis muscle
In ML, a reduction in the diameter of all fibre types was observed along with the progression of renal failure. In the CKD5/6 group, type IIB fibre diameter was smaller and close to reaching statistical significance when compared with the control group (p=0.08), (Table 3).
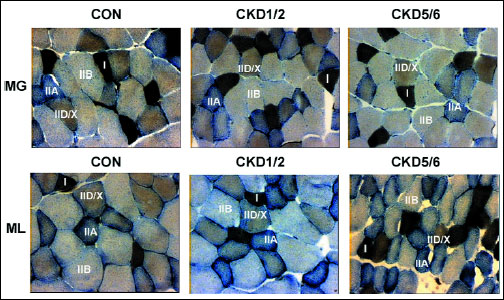 |
Fig. 1. Fibre type composition in the gastrocnemius muscle (MG) and the longissimus thoracis muscle (ML) in studied animal groups: control (CON), uninephrectomy (CKD1/2) and subtotal nephrectomy (CKD5/6). Based on the histochemical reaction for myofibrillar ATPase and NADH-TH according to Ziegan’s method four types of muscle fibres were identified: I, IIA, IID/X, and IIB. Zoom × 125. |
Percentage distribution of muscle fibres (Fig. 1).
1. Gastrocnemius muscle
No statistically significant differences were found in the distribution of various muscle fibre types in the gastrocnemius across groups. However, a tendency to an increasing percentage of type IID/X fibres was observed with the progression of renal failure. In the CKD1/2 group, type I fibre percentage tended to be 6% higher than in other groups (Fig. 2).
2. Longissimus thoracis muscle
In CKD1/2, a statistically significant greater percentage of type IID/X fibres and a smaller percentage of type IIB fibres were found when compared to the remaining groups. In the CKD1/2 group, a tendency to a greater by 7% percentage of type I fibres was determined in comparison with the control group (Fig. 3).
DISCUSSION
The study showed a negative effect of the experimental CKD on the nutritional parameters and inflammation markers as well as muscle fibre diameters, predominantly fast-twitch IIB in the non-locomotor, longissimus thoracis muscle (ML). We identified significantly higher levels of haptoglobin, which is an acute phase protein, in both CKD groups as compared to the control group. This suggests that inflammation could be present in the early stages of CKD (uninephrectomy group) even when creatinine and BUN values are in the range of normal values. CKD5/6 rats were characterised by higher concentrations of AGEs and homocysteine when compared to CKD1/2. This fact confirmed the occurrence of intensified oxidative stress and protein glycation accompanying deteriorating kidney function. Along with the progression of CKD, rats showed significantly less weight gain. Albumin concentration, although not statistically significant, was lower in both CKD groups when compared with the control group. Despite the lack of differences in the concentration of haptoglobin and albumin, CKD5/6 rats had significantly less weight gain as compared to CKD1/2. The most commonly used marker of depleted protein stores in CKD is hypoalbuminaemia, which could be indicative of the development of protein malnutrition. Unfortunately, CKD-induced hypoalbuminaemia and lost protein stores are not generally remedied by raising protein intake. Metabolic disorders induced by CKD are therefore the result of mechanisms that cannot be eliminated exclusively by means of a dietary intervention (31). In the present experiment, rats received a diet containing 17% of protein. Analysis of food and calories consumed by rats showed a non-significant decrease of about 10% in CKD5/6 as compared to CON. Meireles et al. (32) indicated that pair-fed rats after subtotal nephrectomy (CRF) fed an 8% protein diet had the highest efficiency of the utilisation of protein for growth, while a 17% protein diet promoted the highest efficiency of utilisation of food and calories for growth. Only CRF rats eating 30% protein gained significantly less weight and length compared to their controls or CRF rats fed an 8 or 17% diet and they also developed metabolic acidaemia. These findings indicate that when the amount of dietary protein is excessive in CKD rats, anorexia will limit the calorie intake and reduce the efficiency of dietary protein utilisation for growth. An excess of dietary protein could also lead to metabolic acidosis, which stimulates the degradation of branched-chain amino acids and protein leading to the loss of lean body mass (32). Due to a pre-analytical error, we were unable to provide results of blood pH in our experiment. Nevertheless, Bailey et al. (33) indicated that even a modest degree of acidification with an average serum bicarbonate of 20 mM was capable of stimulating proteolysis via the activation of the ATP-ubiquitin-proteasome pathway in CRF. The rate of protein degradation in muscles was still slightly higher in non-acidotic CRF rats receiving NaHCO3 supplementation, than the rate in pair-fed control rats. While Wesson et al. (34) showed that rats with nephron mass reduced by 2/3 (Nx) eating 20% protein as casein had similar plasma acid-base parameters and urine acid excretion, yet had a higher acid content in the paraspinous muscle as measured by microdialysis, as compared to the sham group. These results indicated that even after the correction of metabolic acidaemia there could still be higher content of acid in the skeletal muscle which favours proteolysis. Contrary to above data, a study performed by Ding et al. (35) on CRF pair-fed rats with 24% of protein in diet indicated significantly lower body weights of the CRF rats (200±11 grams) as compared to control (256±28 grams) with no difference in blood pH and pCO2. Authors concluded that abnormal skeletal muscle protein metabolism in CKD relies on the resistance to the IGF-1 due to impaired activity of IGF-1 receptor tyrosine kinase. A study performed on a group of 15 patients with chronic renal failure with the serum creatinine concentrations range of 3.3–9.1 mg/dl did not indicate significant correlations between whole-body leucine rate of appearance (a marker of whole-body proteolysis) and blood pH or plasma albumin concentration, while a positive linear relationship was found between plasma creatinine concentration and the rate of whole-body protein degradation (36). These results suggest that also other factors besides metabolic acidosis could activate accelerated protein degradation, hypoalbuminaemia and muscle wasting along with the progression of CKD.
It is well established that CKD is associated with an increase in circulating levels of inflammatory cytokines which are a potent trigger of muscle wasting and cachexia (37). Available data suggest that proinflammatory cytokines such as IL-6 and TNF-α play important roles in the development of these complications (10). TNF-α and IL-6 are potent activators of NF-κB (nuclear factor kappa B) in the skeletal muscle, which constitutes a transcription factor involved in inflammatory and proliferative responses (38). Activation of NF-κB leads to muscle wasting by increasing the expression of the muscle-specific ubiquitin ligases MuRF1 and atrogin-1/MAFbx which ubiquitylate myosin and other thick filament proteins, as well as actin and other thin filament proteins. Expression of these ligases is strongly induced under various catabolic conditions, both physiological and pathological, whereas anabolic signals, such as insulin or IGFs, antagonise this process (39). Pro-inflammatory cytokines are also able to induce cyclooxygenase-2 (COX-2) which plays an important role in skeletal muscle cachexia. In a study by Martin et al. (40) lipopolysaccharide endotoxin (LPS) injection in male rats led to an increase in COX-2 mRNA expression with subsequent upregulation of the MuRF1 and atrogin-1 in the gastrocnemius muscle. Those changes were associated with a reduction in muscle cross-sectional area and fibre cross-sectional area. Inhibition of COX-2 by meloxicam administration had protective effects on the skeletal muscle, especially when administered during the initial phases of inflammation. Subsequently, it was shown that inflammation can cause defects in the insulin/IGF-1 intracellular signalling through phosphorylation and secondary degradation of the insulin receptor substrate-1 (IRS-1), resulting in the acceleration of muscle protein breakdown. In fact, insulin-induced intracellular signalling is impaired not only by inflammation but also by CKD, metabolic acidosis or angiotensin II (31). Proinflammatory cytokines also negatively influence appetite and eating behaviour, leading to cytokine-induced anorexia (41). Thus, many metabolic disturbances in the course of CKD can jointly activate pathways leading to anorexia, malnutrition and atrophy of the muscle fibres observed in CKD5/6 rats.
The most frequently reported in the literature histomorphological disorder of the skeletal muscle structure in the course of CKD is atrophy and grouping of fast-twitch fibres (type II) in the proximal muscles of the lower limbs, such as the quadriceps femoris muscle (extensor), in haemodialysed patients with concomitant symptoms of protein-calorie malnutrition (42). These non-specific disorders are also observed in patients with calcium-phosphate imbalance, secondary hyperparathyroidism and neuropathy (43).
In the present study, we indicated a decrease in the diameter of muscle fibres in both studied muscles along with the progression of CKD. Atrophic changes were more pronounced in the fast-twitch fibres (IIB), but only in the longissimus thoracis muscle (non-locomotor, extensor) in the CKD5/6 group these differences were close to reaching statistical significance (p=0.08 vs CON). Our results, showing atrophy of type II fibres, therefore remain in line with results obtained by other authors (21, 25). However, type I fibre diameters in MG muscle (locomotor, flexor) in the group subjected to uninephrectomy (CKD1/2) tended to be increased when compared with the control group (Table 2 and 3). Ahonen et al. (22) proved the coexistence of hypertrophy in type I fibres with subsequent atrophy in type II fibres in the gastrocnemius muscle (flexor) in a group of patients at different stages of renal failure. The aforementioned study analysed morphometric results in a group of CKD patients, who either underwent conservative treatment, received a renal replacement therapy (RRT) or were after kidney transplantation. Lindboe et al. (44) showed different impacts of immobilisation, cachexia and denervation on the size of individual fibre types in the tibialis anterior muscle in Wistar rats aged 60–100 days. It was observed that a 30-day immobilisation results in hypertrophy of type I fibres and a slight decrease in the size of type II fibres. Wasting after 20 days of food restrictions induced the atrophy of all fibre types, type II fibres being the most affected ones. While denervation of the muscle after 40 days caused a unique atrophy of type II fibres. It was also indicated that a reduction in muscle mass and muscle strength due to immobilisation is more pronounced in the postural muscles and extensors than in the flexors (45). In the study conducted by Castaneda et al. (46), a negative correlation was found between type I and II fibre diameter and IL-6 concentration among 26 patients suffering from CKD, with mean creatinine clearance of 27.5 ml/min/1.73m2 and treated with a low-protein diet (0.6 g/kg/24h). Moreover, it was proven that 12 weeks of resistance training program was associated with a reduction in inflammation, an increase in albumin concentration as well as hypertrophy of muscle fibres in the vastus lateralis. Reduced physical activity (immobilisation) can be considered as another significant factor contributing to the escalation of myopathic changes in both humans and animals with CKD, whereas physical activity is one of the most effective ways of preventing the loss of muscle mass as a result of pathological catabolism. Kannus et al. (47) showed that a three-week immobilisation was sufficient to produce an increment in the number of pathological fibres as well as muscle fibre size reduction and capillary loss in the locomotor muscles - gastrocnemius and soleus muscles. The aforementioned disorders were reversible by means of physical exercises. The duration of our experiment and the analysis of the amount of chow consumed by rats as well as the results of biochemical tests suggest a greater impact of wasting and immobilisation on the diameter of muscle fibres in CKD rats.
It is well known that different muscle fibres differ in their sensitivity to catabolic signals. The increased predisposition of the glycolytic fibres in CKD to undergo atrophy may arise from several causes. It was confirmed that increased levels of proinflammatory cytokines and TNF-α through the activation of the NF-κB pathway may contribute to the selective atrophy of fast muscle fibres in sepsis and cancer cachexia. An experiment performed on transgenic mice with muscle-specific constitutive activation of the NF-κB pathway showed atrophy of fast but not slow skeletal muscles (48). Hypoxia has also been implicated as a factor contributing to muscle wasting. A larger diameter of type II fibres and their poorer capillary network distribution in comparison to type I fibres predisposes them to an accelerated progression of myopathy. Due to the further distance that oxygen is supposed to diffuse to, hypoxia develops, which restricts the metabolic rate in those fibres (49). Haemoglobin concentration decreases significantly along with deteriorating kidney function in CKD rats, leading to the development of tissue hypoxia. Hypoxia is known to induce the activation of the transcription factor HIF-1α predominantly in glycolytic fibres, which affects and regulates the expression of genes involved in maintaining homeostasis, the regulation of anaerobic metabolism and muscle mass, as well as the process of fibre transformation and cell death (50). Interestingly, in a previous experiment, we indicated that the response to systemic hypoxia in CKD rats through the HIF-1α pathway, may be altered in the skeletal muscle in more advanced stages of renal failure (CKD5/6) (51). A greater predisposition of type II fibres to undergo atrophy may also result from their lower content of myoglobin. Myoglobin, expressed selectively in oxidative type I (slow) and type IIA (fast) skeletal muscle fibres could act as a scavenger of reactive oxygen species in the heart and skeletal muscle (52). This fact is relevant in the light of recent reports which have demonstrated a higher ROS production in skeletal muscle mitochondria, particularly from type II fibres as compared with type I fibres (53). As a result of hypoxia, an elevation of free Ca2+ concentration in cytosol, cellular calcium overload and activation of the ion-dependent proteases occur. Hypoxic cells also paradoxically increase their mitochondrial production of reactive oxygen species (ROS), leading to oxidative stress and membrane lipid peroxidation, which ultimately damages muscle cells (54). Muscles containing predominantly fast-twitch fibres exhibit a higher dependency on calcium ions and more frequently tend to develop atrophic changes (55). Taking those findings into account, it may be presumed that glycolytic muscle fibre atrophy in CKD5/6 rats could be the result of the combined and overlapping influence of several factors associated with CKD: PEW, metabolic disorders, inflammation, insulin resistance, disturbances in HIF-1α pathway signalling and immobilisation.
A unique feature of the skeletal muscles is their diversity resulting from the fact that they are made up of many different types of muscle fibres, as well as the considerable variation of individual fibres. A muscle fibre carries genetic information crucial to the simultaneous expression of all myosin heavy chain (MHC) isoforms: I, IIA, IIX and IIB, in a unique combination depending on external factors. In the muscles of mature individuals, the muscle fibre transformation process progresses according to the following sequence: IIB ![]() IIX
IIX ![]() IIA
IIA ![]() I in both directions, depending on the factor influencing the muscles (56). Previous results concerning individual fibre type distribution in the course of uraemic myopathy tend to vary as far as an increased percentage of both type II (22) and type I fibres (57) is concerned. In the biopsy of the abdominal external oblique muscle (non-locomotor) in CKD patients under conservative treatment (creatinine concentration 558±243 µmol/l), Stein et al. established a significant increase in the number of type I fibres when compared to controls (58). Sakkas et al. did not establish any differences in muscle fibre distribution in the rectus abdominis muscle (non-locomotor) in CKD pre-dialysis patients (creatinine concentration 6.4±2.1 mg/dl) (25). However, in the same muscle in HD patients with an impaired tolerance for physical effort, Kouidi et al. found an increased number of type I fibres and decreased of type II fibres (57). The study conducted by Clyne et al. (24), which included CKD patients (inulin clearance 14.7 ml/min), the biopsy of the lateral head of the quadriceps femoris muscle (locomotor), showed a significant increase in type IIA fibre number and decrease in type IIB fibre number in relation to the controls. The authors suggested that renal failure can stimulate the oxidative capacity of mitochondria and the increased number of type IIA fibres is a form of an adaptive mechanism of response to CKD or anaemia (24). There are authors who suggest that the increase in the percentage of type I fibres could be an adaptive response aiming to maintain muscle endurance by increasing the number of the fibres that are more resistant to fatigue (23). The present study analysed two functionally different skeletal muscles: postural (extensor) muscle - longissimus thoracis muscle, which is a part of the erector spinae muscle - ML and a locomotor muscle (flexor) - gastrocnemius muscle - MG. The analysis of muscle fibre distribution in the control group indicated a similar distribution of individual muscle fibre types, with only 5% higher percentage of type I fibre in ML muscle when compared to MG muscle. Therefore, differences in the distribution of muscle fibres in the CKD groups may result in our opinion on functional differences between those muscles (flexor vs. extensor). An interesting discovery of the present study is the demonstration of a heightened percentage of fibres type IID/X in CKD in relation to the control rats. A statistically significant increase in the number of type IID/X fibres with a simultaneous decrease in the number of type IIB fibres and a tendency to a higher type I percentage were observed in the ML muscles of CKD1/2 subjects. Similar, yet statistically insignificant changes were found in the MG muscle of CKD1/2 subjects, where the percentages of type I and type IID/X fibres tended to increase. Such case may indicate that CKD activates the transformation of fast-twitch fibres into slow-twitch ones, which can constitute a result secondary to renal anaemia, while fulfilling the role of increasing the fibre oxidative capacity depending above all on the ability to regenerate ATP via oxidative phosphorylation (59). A lack of significant changes in muscle fibre distribution in both studied muscles in the more advanced stages of renal failure - CKD5/6, may attest to an inhibition of the fibre transformation process, for example as a secondary result of metabolic disturbances.
I in both directions, depending on the factor influencing the muscles (56). Previous results concerning individual fibre type distribution in the course of uraemic myopathy tend to vary as far as an increased percentage of both type II (22) and type I fibres (57) is concerned. In the biopsy of the abdominal external oblique muscle (non-locomotor) in CKD patients under conservative treatment (creatinine concentration 558±243 µmol/l), Stein et al. established a significant increase in the number of type I fibres when compared to controls (58). Sakkas et al. did not establish any differences in muscle fibre distribution in the rectus abdominis muscle (non-locomotor) in CKD pre-dialysis patients (creatinine concentration 6.4±2.1 mg/dl) (25). However, in the same muscle in HD patients with an impaired tolerance for physical effort, Kouidi et al. found an increased number of type I fibres and decreased of type II fibres (57). The study conducted by Clyne et al. (24), which included CKD patients (inulin clearance 14.7 ml/min), the biopsy of the lateral head of the quadriceps femoris muscle (locomotor), showed a significant increase in type IIA fibre number and decrease in type IIB fibre number in relation to the controls. The authors suggested that renal failure can stimulate the oxidative capacity of mitochondria and the increased number of type IIA fibres is a form of an adaptive mechanism of response to CKD or anaemia (24). There are authors who suggest that the increase in the percentage of type I fibres could be an adaptive response aiming to maintain muscle endurance by increasing the number of the fibres that are more resistant to fatigue (23). The present study analysed two functionally different skeletal muscles: postural (extensor) muscle - longissimus thoracis muscle, which is a part of the erector spinae muscle - ML and a locomotor muscle (flexor) - gastrocnemius muscle - MG. The analysis of muscle fibre distribution in the control group indicated a similar distribution of individual muscle fibre types, with only 5% higher percentage of type I fibre in ML muscle when compared to MG muscle. Therefore, differences in the distribution of muscle fibres in the CKD groups may result in our opinion on functional differences between those muscles (flexor vs. extensor). An interesting discovery of the present study is the demonstration of a heightened percentage of fibres type IID/X in CKD in relation to the control rats. A statistically significant increase in the number of type IID/X fibres with a simultaneous decrease in the number of type IIB fibres and a tendency to a higher type I percentage were observed in the ML muscles of CKD1/2 subjects. Similar, yet statistically insignificant changes were found in the MG muscle of CKD1/2 subjects, where the percentages of type I and type IID/X fibres tended to increase. Such case may indicate that CKD activates the transformation of fast-twitch fibres into slow-twitch ones, which can constitute a result secondary to renal anaemia, while fulfilling the role of increasing the fibre oxidative capacity depending above all on the ability to regenerate ATP via oxidative phosphorylation (59). A lack of significant changes in muscle fibre distribution in both studied muscles in the more advanced stages of renal failure - CKD5/6, may attest to an inhibition of the fibre transformation process, for example as a secondary result of metabolic disturbances.
Taes et al., for instance, indicated that a decrease in the number of type I fibres with a complementary increase in type II fibres is secondary to carnitine deficiency in Wistar rats 4 weeks after subtotal nephrectomy (60). Thus, carnitine deficiency, which interferes with the oxidation of long-chain fatty acids constituting the main sources of energy for oxidative fibres, may be a causative factor (61).
Bar and Pette (62) were the first to prove the existence of type IID/X fibres in rat skeletal muscles in the diaphragm, deep parts of the gastrocnemius muscle and during the stimulation-provoked transformation of fast-twitch fibres into slow-twitch ones. Other authors also confirmed the presence of four MHC isoforms, with a predominance of the fast-twitch isoforms, in the medial portion of the rat gastrocnemius muscle. A higher percentage of IIx isoforms was more frequently detected in male rather than female rats (63).
Muscle wasting induced by sepsis, cachexia, starvation and acute diabetes is characterised by a fast-to-slow fibre type shift similar to that induced by glucocorticoids. Nutritional deprivation and release of proinflammatory cytokines, such as TNF-a, have been implicated in these conditions (48). A fast-to-slow fibre type shift is also seen during aging, when muscle atrophy is especially evident in type IIB fibres and is accompanied by a decrease in MHC IIB concentration together with a simultaneous increase in MHC IID/X and a potential increase in MHC IIA and MHC I in rat tibialis anterior (64). Oxidative stress, inflammation and accumulation of AGEs, which are related to ageing in the general population, are also strongly involved in the pathogenesis of accelerated aging and enhanced cellular senescence of skeletal muscles in CKD (65). Decreased skeletal muscle protein synthesis, increased oxidative stress and catabolic cytokines (e.g. IL-6, IL1β, and TNF-α) as well as impaired glucose metabolism are characteristic features of age-related sarcopoenia. Studies performed on animal models of sarcopoenia have suggested that an increased activity of NF-κB may contribute to age-related muscle loss (39). The same metabolic disturbances and disorders of skeletal muscle microstructure are found in the skeletal muscle of rats from the CKD groups, which may justify considering CKD as a process of accelerated aging of skeletal muscle cells.
Diversified morphometric changes in the progression of uraemic myopathy found in the literature may result from differences in the functions of studied muscles and in the technique of muscle fibre selection (histochemistry, immunohistochemistry, MHC electrophoresis), as well as CKD stages, comorbidities and the type of CKD therapy - conservative versus continuous renal replacement therapy.
To summarise, in the present study, it was established that even in rats which underwent uninephrectomy, inflammation, anaemia, hyperhomocysteinaemia and hypoalbuminaemia were found. In more advanced stages of CKD, exacerbation of the aforementioned conditions occurs, which may result in the observed muscle fibre atrophy, predominantly of glycolytic fibres in the non-locomotor muscle (ML). In the CKD1/2 group, a significant increase in the percentage of fast-twitch fibres type IID/X with an accompanying decrease of fibres type IIB in ML muscle was found, thus indicating the induction of fast-to-slow fibre transformation. Establishing statistically significant changes in fibre distribution only in the CKD1/2 group with a lack thereof in the CKD5/6 group may attest to an inhibition of muscle cell compensatory mechanisms in the more advanced stages of CKD. In the CKD5/6 group, metabolic disorders were found, which were then involved in the progression of muscle cell structural and functional changes. Conducting follow-up studies is essential to establishing the pathogenesis of the disorders of skeletal muscle structure in CKD.
Differences in the percentage distribution of muscle fibres in the progression of CKD could result from the scientific method applied. The histochemical method does not allow for a precise distinction between hybrid fibres (composed of two different MHC isoforms). Moreover, changes in myosin heavy chain expression are not always concomitant with changes in enzyme activity within the muscle cell. In order to avoid such uncertainties, electrophoretic distribution or immunohistochemical technique of isolating MHC isoforms should be applied along with the histochemical test. Differences in rat body mass at the end of the experiment could have reflected the diameter of muscle fibres. In order to eliminate differences in the amount of consumed chow, "pair-feeding" should be utilised. Despite not having utilised all available scientific methods, it is the authors' opinion that the obtained results offer an interesting insight into the etiopathogenesis of uraemic myopathy and provide a direction for further studies.
Acknowledgements: This study was supported by grants from the Nicolas Copernicus University and the "NerkaDar" Foundation.
Conflict of interests: None declared.
REFERENCES
- Serratrice G, Toga M, Roux H, Murisasco A, de Bisschop G. Neuropathies, myopathies and neuromyopathies in chronic uremic patients. Presse Med 1967; 75: 1835-1838.
- Campistol JM. Uremic myopathy. Kidney Int 2002; 62: 1901-1913.
- Fahal IH. Uraemic sarcopenia: aetiology and implications. Nephrol Dial Transplant 2013; April 25 [epub ahead of print]. doi: 10.1093/ndt/gft070
- Fouque D, Kalantar-Zadeh K, Kopple J, et al. A proposed nomenclature and diagnostic criteria for protein-energy wasting in acute and chronic kidney disease. Protein-energy wasting in kidney disease. Kidney Int 2008; 73: 391-398.
- Kopple JD. McCollum Award Lecture, 1996: protein-energy malnutrition in maintenance dialysis patients. Am J Clin Nutr 1997; 65: 1544-1557.
- Kopple JD, Greene T, Chumlea WC, et al. Relationship between nutritional status and the glomerular filtration rate: results from the MDRD Study. Kidney Int 2000; 57: 1688-1703.
- Mitch WE, Goldberg AL. Mechanisms of muscle wasting. The role of the ubiquitin-proteasome pathway. N Engl J Med 1996; 335: 1897-1905.
- Kaysen GA. The microinflammatory state in uremia: causes and potential consequences. J Am Soc Nephrol 2001; 12: 1549-1557.
- Hou FF, Ren H, Guo ZJ, Chen PY, Liang M, Zhang X. Activation of receptor for advanced glycation end products: mechanism for monocyte-mediated inflammation in chronic renal failure. Zhonghua Yi Xue Za Zhi 2004; 84: 1614-1619.
- Stenvinkel P, Ketteler M, Johnson RJ, et al. IL-10, IL-6, and TNF-alpha: central factors in the altered cytokine network of uremia - the good, the bad, and the ugly. Kidney Int 2005; 67: 1216-1233.
- Siew ED, Ikizler TA. Insulin resistance and protein energy metabolism in patients with advanced chronic kidney disease. Semin Dial 2010; 23: 378-382.
- Taniyama Y, Hitomi H, Shah A, Alexander RW, Griendling KK. Mechanisms of reactive oxygen species-dependent downregulation of insulin receptor substrate-1 by angiotensin II. Arterioscler Thromb Vasc Biol 2005; 25: 1142-1147.
- Du J, Hu Z, Mitch WE. Cellular signals activating muscle proteolysis in chronic kidney disease: a two stage process. Int J Biochem Cell Biol 2005; 37: 2147-2155.
- Teplan V, Schuck O, Horackova M, Skibova J, Holecek M. Effect of a keto acid-amino acid supplement on the metabolism and renal elimination of branched-chain amino acids in patients with chronic renal insufficiency on a low protein diet. Wien Klin Wochenschr 2000; 112: 876-881.
- Boland R. Role of vitamin D in skeletal muscle function. Endocr Rev 1986; 7: 434-448.
- Smogorzewski M, Piskorska G, Borum PR, Massry SG. Chronic renal failure, parathyroid hormone and fatty acids oxidation in skeletal muscle. Kidney Int 1988; 33: 555-560.
- Flisinski M, Brymora A, Elminowska-Wenda G, et al. Influence of different stages of experimental chronic kidney disease on rats locomotor and postural skeletal muscles microcirculation. Ren Fail 2008; 30: 443-451.
- Yazdi PG, Moradi H, Yang JY, Wang PH, Vaziri ND. Skeletal muscle mitochondrial depletion and dysfunction in chronic kidney disease. Int J Clin Exp Med 2013; 6: 532-539.
- Utaka S, Avesani CM, Draibe SA, Kamimura MA, Andreoni S, Cuppari L. Inflammation is associated with increased energy expenditure in patients with chronic kidney disease. Am J Clin Nutr 2005; 82: 801-805.
- Adams GR, Vaziri ND. Skeletal muscle dysfunction in chronic renal failure: effects of exercise. Am J Physiol Renal Physiol 2006; 290: F753-F761.
- Diesel W, Emms M, Knight BK, et al. Morphologic features of the myopathy associated with chronic renal failure. Am J Kidney Dis 1993; 22: 677-684.
- Ahonen R. Light microscopic study of striated muscle in uremia. Acta Neuropathol (Berlin) 1980; 49: 51-55.
- Lewis MI, Fournier M, Wang H, et al. Metabolic and morphometric profile of muscle fibers in chronic hemodialysis patients. J Appl Physiol 2012; 112: 72-78.
- Clyne N, Esbjornsson M, Jansson E, Jogestrand T, Lins LE, Pehrsson SK. Effects of renal failure on skeletal muscle. Nephron 1993; 63: 395-399.
- Sakkas GK, Ball D, Mercer TH, Sargeant AJ, Tolfrey K, Naish PF. Atrophy of non-locomotor muscle in patients with end-stage renal failure. Nephrol Dial Transplant 2003; 18: 2074-2081.
- Holecek M. Muscle wasting in animal models of severe illness. Int J Exp Pathol 2012; 93: 157-171.
- Ziegan J. Kombinationem enzymhistochemischer Methoden zur Fasertypendifferenzierung und Beurteilung der Skelettmuskulatur. Acta Histochem 1979; 65: 34-40.
- Wank V, Bauer R, Punkt K, Ziegan J. Enzyme activity patterns of myosin ATPase, alpha-glycerophosphate dehydrogenase and succinate dehydrogenase within different muscle fibre types. Acta Histochem 1994; 96: 213-218.
- Brooke MH, Kaiser KK. Muscle fiber types: how many and what kind? Arch Neurol 1970; 23: 369-379.
- Chamberlain RM, Shirley DG. Time course of the renal functional response to partial nephrectomy: measurements in conscious rats. Exp Physiol 2007; 92: 251-262.
- Wang XH, Mitch WE. Muscle wasting from kidney failure - a model for catabolic conditions. Int J Biochem Cell Biol 2013; 45: 2230-2238.
- Meireles CL1, Price SR, Pereira AM, Carvalhaes JT, Mitch WE. Nutrition and chronic renal failure in rats: what is an optimal dietary protein? J Am Soc Nephrol 1999; 10: 2367-2373.
- Bailey JL, Wang X, England BK, Price SR, Ding X, Mitch WE. The acidosis of chronic renal failure activates muscle proteolysis in rats by augmenting transcription of genes encoding proteins of the ATP-dependent ubiquitin-proteasome pathway. J Clin Invest 1996; 97: 1447-1453.
- Wesson DE, Simoni J. Increased tissue acid mediates a progressive decline in the glomerular filtration rate of animals with reduced nephron mass. Kidney Int 2009: 75: 929-935.
- Ding H, Gao XL, Hirschberg R, Vadgama JV, Kopple JD. Impaired actions of insulin-like growth factor 1 on protein synthesis and degradation in skeletal muscle of rats with chronic renal failure. Evidence for a postreceptor defect. J Clin Invest 1996; 97: 1064-1075.
- Biolo G, Toigo G, Ciocchi B, et al. Relationship between whole-body protein turnover and serum creatinine in chronically uremic patients. Miner Electrolyte Metab 1998; 24: 267-272.
- Miyamoto T, Carrero JJ, Stenvinkel P. Inflammation as a risk factor and target for therapy in chronic kidney disease. Curr Opin Nephrol Hypertens 2011; 20: 662-668.
- Guttridge DC, Mayo MW, Madrid LV, Wang CY, Baldwin AS Jr. NF-kappaB-induced loss of MyoD messenger RNA: possible role in muscle decay and cachexia. Science 2000; 289: 2363-2366.
- Li H, Malhotra S, Kumar A. Nuclear factor-kappa B signaling in skeletal muscle atrophy. J Mol Med (Berl) 2008; 86: 1113-1126.
- Martin AI, Nieto-Bona MP, Castillero E, et al. Effect of cyclooxygenase-2 inhibition by meloxicam, on atrogin-1 and myogenic regulatory factors in skeletal muscle of rats injected with endotoxin. J Physiol Pharmacol 2012; 63: 649-659.
- Grunfeld C, Zhao C, Fuller J, et al. Endotoxin and cytokines induce expression of leptin, the ob gene product, in hamsters. J Clin Invest 1996; 97: 2152-2157.
- Fahal IH, Bell GM, Bone JM, Edwards RH. Physiological abnormalities of skeletal muscle in dialysis patients. Nephrol Dial Transplant 1997; 12: 119-127.
- Ruff RL, Weissmann J. Endocrine myopathies. Neurol Clin 1988; 6: 575-592.
- Lindboe CF, Presthus J. Effects of denervation, immobilization and cachexia on fiber size in the anterior tibial muscle of the rat. Acta Neuropathol 1985; 66: 42-51.
- Berchtold MW, Brinkmeier H, Muntener M. Calcium ion in skeletal muscle: its crucial role for muscle function, plasticity and disease. Physiol Rev 2000; 80: 1215-1265.
- Castaneda C, Gordon PL, Parker RC, Uhlin KL, Roubenoff R, Levey AS. Resistance training to reduce the malnutrition-inflammation complex syndrome of chronic kidney disease. Am J Kidney Dis 2004; 43: 607-616.
- Kannus P, Jozsa L, Kvist M, Jarvinen T, Jarvinen M. Effects of immobilization and subsequent low- and high-intensity exercise on morphology of rat calf muscles. Scand J Med Sci Sports 1998; 8: 160-171.
- Ciciliot S, Rossia AC, Dyara KA, Blaauw B, Schiaffino S. Muscle type and fiber type specificity in muscle wasting. Int J Biochem Cell Biol 2013; 45: 2191-2199.
- Fredsted A, Mikkelsen UR, Gissel H, Clausem T. Anoxia induces Ca2+ influx and loss of cell membrane integrity in rat extensor digitorum longus muscle. Exp Physiol 2005; 90: 703-714.
- Pisani DF, Dechesne CA. Skeletal muscle HIF-1 alpha expression is dependent on muscle fiber type. J Gen Physiol 2005; 126: 173-178.
- Flisinski M, Brymora A, Bartlomiejczyk I, et al. Decreased hypoxia-inducible factor-1alpha in gastrocnemius muscle in rats with chronic kidney disease. Kidney Blood Press Res 2012; 35: 608-618.
- Kanatous SB, Mammen PP, Rosenberg PB, et al. Hypoxia reprograms calcium signaling and regulates myoglobin expression. Am J Physiol Cell Physiol 2009; 296: C393-C402.
- Anderson EJ, Neufer PD. Type II skeletal myofibers possess unique properties that potentiate mitochondrial H2O2 generation. Am J Physiol Cell Physiol 2006; 290: C844-C851.
- Pialoux V, Mounier R, Brown AD, Steinback CD, Rawling JM, Poulin MJ. Relationship between oxidative stress and HIF-1alpha mRNA during sustained hypoxia in humans. Free Radic Biol Med 2009; 46: 321-326.
- Pette D, Staron RS. Cellular and molecular diversities of mammalian skeletal muscle fibers. Rev Physiol Biochem Pharmacol 1990; 116: 1-76.
- Pette D, Staron RS. Myosin isoforms, muscle fiber types, and transitions. Microsc Res Tech 2000; 50: 500-509.
- Kouidi E, Albani M, Natsis K, et al. The effects of exercise training on muscle atrophy in haemodialysis patients. Nephrol Dial Transplant 1998; 13: 685-699.
- Stein G. Schmidt A, Sperschneider H, et al. Morphometrische und histochemische untersunchungen der skelettmuskulatur von patienten mit chronischer niereninsuffizienz und dialysepatienten. Z Urol Nephrol 1986; 79: 559-567.
- Holloszy JO, Boot FW. Biochemical adaptations to endurance exercise in muscle. Ann Rev Physiol 1976; 38: 273-291.
- Taes YE, Speeckaert M, Bauwens E, et al. Effect of dietary creatine on skeletal muscle myosin heavy chain isoform expression in an animal model of uremia. Nephron Exp Nephrol 2004; 96: e103-e110.
- Miklosz A, Chabowski A, Zendzian-Piotrowska M, Gorski J. Effects of hyperthyroidism on lipid content and composition in oxidative and glycolytic muscles in rats. J Physiol Pharmacol 2012; 63: 403-410.
- Bär A, Pette D. Three fast myosin heavy chains in adult rat skeletal muscle. FEBS Lett 1988; 235: 153-155.
- Drzymala-Celichowska H, Karolczak J, Redowicz MJ, Bukowska D. The content of myosin heavy chains in hindlimb muscles of female and male rats. J Physiol Pharmacol 2012; 63: 187-193.
- Larsson L, Biral D, Campione M, Schiaffino S. An age-related type IIB to IIX myosin heavy chain switching in rat skeletal muscle. Acta Physiol Scand 1993; 147: 227-234.
- Kooman JP, Broers NJH, Usvyat L, et al. Out of control: accelerated aging in uremia. Nephrol Dial Transplant 2013; 28: 48-54.
A c c e p t e d : June 10, 2014