B-cells are the core constituent of the immunological system. When stimulated by an antigen, a mature B-cell proliferates and differentiates to cell producing and secreting antibodies (Ab). Therefore, the mechanisms that affect the function of B-lymphocytes have a significant impact on the humoral immune response. Impaired lymphocyte function and enhanced susceptibility to infections is a common feature of human diabetes (1). The reason for this increased susceptibility in diabetic patients is not fully understood. Some indications point to adenosine as a factor of the pathomechanism leading to the altered functioning of the lymphocytes in diabetes (2, 3).
Adenosine is an endogenous compound exerting a potent action on the immune system.
Clinical observations of patients with severe combined immunodeficiency have
documented the importance of adenosine to the development and function of the
immune cells (4). The experimental data gathered to date indicate the ability
of adenosine to affect events such as lymphocyte activation, proliferation,
cytokines production, and lymphocyte-mediated cytolysis (5). Adenosine is formed
both in the extra- and intracellular space (6, 7) and exerts its biological
effect by coupling with cell-surface receptors in a paracrine or autocrine fashion.
To date, four adenosine receptors (ARs) have been identified, namely A
1,
A
2A, A
2B, and A
3 (8). Development of diabetes results in an altered expression
of ARs in many types of cells (9, 10). Moreover, it appears that diabetes-induced
changes in ARs expression are tissue and cell type specific (11). Experiments
on cells in culture have indicated that these alterations are largely induced
by changes in glucose concentrations (2). Little is known about the ARs status
in B lymphocytes during the development of diabetes. There is also a lack of
data concerning the consequences for ARs expression in B lymphocytes arising
from changes in glucose concentration. Therefore, the objective of our study
was to investigate the expression level of adenosine receptors in B lymphocytes
cultured at different glucose concentrations. We evaluated the signaling pathways
utilized by glucose to regulate the ARs expression level in rat B lymphocytes.
MATERIALS AND METHODS
Reagents
Histopaque-1077, insulin, penicillin, streptomycin, 2'-amino-3'-methoxyflavone
(PD 98059), 3-(3,5-dibromo-4-hydroxybenzyliden)-5-iodo-1,3-dihydroindol-2-one
(GW 5074), glucose, wortmannin, leupeptin, thiobutabarbital sodium (Inactin),
and RPMI-1640 medium, were obtained from Sigma-Aldrich Sp. z o.o. (Poznan, Poland).
Bisindolylmaleimide I (Bis I), 4-(4-Fluorophenyl)-2-(4-methylsulfinylphenyl)-5-(4-pyridyl)1H-imidazole
(SB 203580), rottlerin, calphostin C, [12-(2-cyanoethyl)]Q1-6,7,12,13-tetrahydro-13-methyl-5-oxo-5H-indolo(2,3-a)pyrrolo(3,4-c)-carbazole
(Go 6976), {2-[1-(3-dimethylaminopropyl)-5-methoxyindol-3-yl]-3-3(1H-indol-3-yl)maleimide
(Go 6983), and cell permeable PKC-

pseudosubstrate sequence (Myr-SIYRRGARRWRKL-OH) were obtained from Calbiochem-Merck
Sp. z o.o. (Warsaw, Poland). All primers used were from Integrated DNA Technologies,
Inc. (Coralville, IA, USA). Total RNA Prep Plus Kit was from A&A Biotechnology
(Gdansk, Poland). Primary rabbit polyclonal antibodies to A
1-AR
(A-268), and b-actin, were from Sigma-Aldrich Sp. z o.o. (Poznan, Poland). Rabbit
polyclonal antibody to A
2B-AR (AB1589P) was
from Chemicon International (Temecula, CA, USA). Goat polyclonal antibodies
to A
2A-AR (R-18), and A
3-AR
(C-17), were from Santa Cruz Biotechnology, Inc. (Santa Cruz, CA, USA). Fluorescein
conjugate mouse anti rat CD2[LFA-2] (clone OX-34) was from Chemicon International
(Hofheim, Germany). Fluorescein conjugate Armenian hamster anti rat CD40 (clone
HM40-3), and mouse anti rat CD19 (clone 1D3) were from BD Biosciences (Heidelberg,
Germany).
Animals
Male Wistar rats (200-240 g) fed on Altromin C 1000 diet (Altromin GmbH, Lage,
Germany) were used for all experiments. All animals had access to food and water
ad libitum.
Cells and culture conditions
Single cell suspension of splenocytes was prepared by pressing spleens through
sterilized 20 mm pore size nylon mesh gauze in the presence of sterile saline.
Mononuclear cells were isolated by centrifugation of the cell suspension through
Histopaque-1077 at 400 x g for 30 minutes at room temperature. Cells found at
the saline/Histopaque interface were washed and suspended in RPMI-1640 medium
supplemented with 3% BSA. The cells were then separated into adhesive and nonadhesive
by the panning method as described previously (12). The purity of isolated cell
fractions was examined by flow cytometry. The adherent fraction (B cells) contained
95-97% CD2 (OX-34) negative cells, 89-93% CD40 (HM40-3) and 85-90% CD19 (1D3)
positive cells. The number of
viable cells was determined by Trypan Blue
dye exclusion. Only cell preparations with a 95%
viability or greater
were used. Cells were cultured for 48 hours in flat-bottomed culture bottles
in humidified atmosphere containing 5% CO
2 at
37°C at a density of 2-4 x 10
6 cells/ml in RPMI-1640
medium supplemented with penicillin (100 units/ml), streptomycin (100 mg/ml),
and 10% fetal bovine serum and containing glucose at concentration detailed
in the figure legends. The compounds examined (glucose, and inhibitors) were
added to lymphocyte culture in the concentration and the order and for the time
detailed in the figure legends. Inhibitors were dissolved in a small volume
(less than 0.2% of the total volume of culture medium) of DMSO. The osmolarity
of the culture medium was maintained constant by the addition of appropriate
amount of D-mannitol.
Real-time PCR analysis
The levels of ARs transcripts were analyzed by real-time PCR performed in a
Light Cycler 2.0 (Roche Diagnostics GmbH) using the Light Cycler DNA SYBR Green
I Kit. The reaction mixture contained 1 ml Master Mix, 5 pmol of each primer
and 2 µl of cDNA. The primers for A
1-AR, A
2A-AR,
A
2B-AR, A
3-AR,
and ß-actin cDNA amplification were as described previously (11). As a
negative controls water was run with every PCR. The specificity of product was
controlled by melting curve analysis, and by agarose gel electrophoresis. The
ratio of AR/ ß-actin was calculated for each sample. Analysis of the data
was done using Light Cycler software 4.0.
Western blot analysis
The extract of B cells was obtained by sonication (3 x 15 s) of cell suspension in 20 mM Tris-HCl, pH 7.2, 1 mM dithiothreitol, 0.2 mM Pefabloc SC, and 5 mM leupeptin. The proteins from obtained extract were separated by 12% SDS-polyacrylamide gel electrophoresis, and electrophoretically transferred to Immobilon poly(vinylidene difluoride) transfer membrane. The membrane was incubated at 4°C (overnight) with 3% BSA in Tris-buffered saline (TBS). The membrane was then cut horizontally at appropriate position (based on positions of prestained molecular mass markers), and incubated with appropriate primary antibodies. Next the membrane strips were incubated with alkaline phosphatase-conjugated secondary antibodies. Membrane bound antibodies were visualized with 5-bromo-4-chloro-3-indoyl phosphate and nitroblue tetrazolium. For A
1-AR and A
2B-AR the b-actin was used as a reference protein. The p-14-3-3 protein was a reference protein for A
2A-AR and A
3-AR.
Statistical analysis
The statistical calculation was performed with ANOVA or Dunnett's test for comparison
to control group. Paired Student's t-test was performed when two groups were
analyzed.
P values below 0.05 were considered as significant.
RESULTS
The glucose effect on adenosine receptors proteins level in rat B lymphocytes
To investigate the glucose effect on adenosine receptors (ARs) expression in
rat B lymphocytes, we first determined which AR types are present in these cells.
The AR proteins were analyzed by Western blot with type-specific polyclonal
antibodies. Our investigation revealed the presence of all four ARs proteins
in the rat B cell extract, although the protein bands of A
2A-AR
and A
3AR were weak (
Fig. 1). The levels
of ARs proteins were similar in isolated cells before and after 3 days of culture
in an RPMI medium containing 5 mM glucose (not shown). This indicates that the
expression level of ARs did not change significantly during the first days of
cell culture (up to 3 days). Exposition of B cells to 25 mM glucose for 48 h
resulted in a decrease of the AR proteins (A
2B-AR
and A
3-AR, to undetectable levels) with the
exception of A
2A-AR, which did not change significantly
(
Fig. 1).
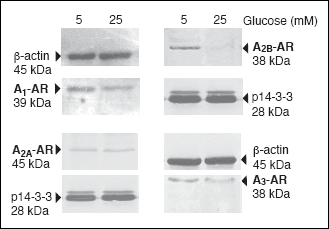 |
Fig. 1. The protein level of adenosine receptors in rat B lymphocytes cultured in various glucose concentrations. B lymphocytes isolated from rat spleen were cultured for 48 hours at the indicated glucose concentrations and the protein extracts were prepared as described under "Materials and Methods". The proteins were separated on 12% SDS-PAGE and immunoblotted with appropriate antibodies. The presented blots are representative of those obtained in at least three independent experiments. |
The high glucose effect on A1-AR expression in rat B lymphocytes
The level of ARs proteins was very low in the B cell extracts; the Western blot
analysis had therefore given us the qualitative data but was of no use in terms
of quantitative analysis. To examine the expression of ARs we determined the
levels of mRNAs by real-time PCR.
Fig. 2 depicts the concentration and
time-dependent effect of glucose on the expression of A
1-AR.
Glucose at a concentration of up to 10 mM did not significantly affect the A
1-AR
mRNA level; at higher concentration, however, it suppressed the expression of
this receptor (
Fig. 2A). The maximal effect of 25 mM glucose on the A
1-AR
mRNA level was observed at the 24
th hour (
Fig.
2B).
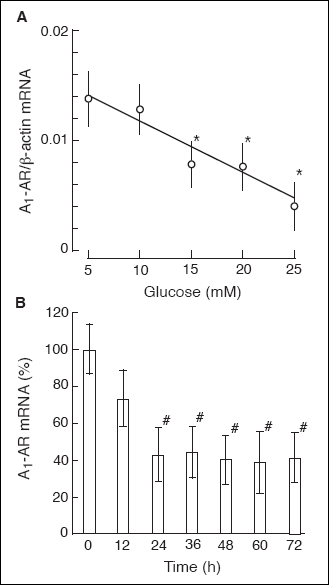 |
Fig. 2. The glucose effect
on the abundance of A1-AR mRNA in rat
B lymphocytes. (A) Dose-dependent course of glucose action on the
A1-AR mRNA level. Cells were cultured
for 48 hours in the presence of glucose at the concentrations indicated.
Next, cells were harvested, total RNA was extracted, and the A1-AR
mRNA level was determined by Real-time PCR as described under "Materials
and Methods". The data represent the mean ±SD from three experiments.
(*) P<0.05 versus 5 mM glucose. (B) Time course of glucose action
on the A1-AR mRNA level. Cells were cultured
in the presence of 5 mM glucose for 20 hours. On the second day (time
0) cells were transferred to the culture medium containing 25 mM glucose.
At time indicated, cells were harvested and the A1-AR
mRNA level was determined as described above. The data represent the mean
±SD from three experiments. (*) P<0.05 versus 0 time. |
The activation of the mitogen-activated protein kinase (MAPK) pathway and protein
kinase C (PKC) is the mechanistic basis of high glucose-induced changes in the
cell (
Fig. 3). To define the key steps of the glucose signaling involved
in suppression of A
1-AR expression we used specific
inhibitors. The exact target of a particular inhibitor is indicated on the scheme
presented in
Fig. 3. Optimal concentrations of the inhibitors were determined
by pilot studies (not shown) and are in accordance with previous reports (13-17).
Wortmannin, an inhibitor of phosphatidyl 3-kinase (PI3-K) did not affect the
glucose action on the A
1-AR transcript level
(
Fig. 4). Pretreatment of B cells with PD 98059 (10 µM), an MAPK kinase
(MEK) inhibitor, abolished the high glucose effect on A
1-AR
transcript level. To further elucidate the glucose-signaling pathway in rat
B lymphocytes we examined the high glucose effect on the A
1-AR
mRNA level under a condition of Raf kinase inhibition. Raf-1 kinase is an upstream
effector of MEK. The inclusion of a selective and potent Raf-1 inhibitor (GW
5074) in the incubation medium had no effect on high glucose-induced suppression
of A
1-AR expression. The inhibition of p38 MAP
kinase with SB 203580 (1 µM) did not affect the action of glucose on the A
1-AR
mRNA level. To evaluate the role of PKC in high glucose-induced suppression
of A
1-AR mRNA we used different PKC inhibitors.
Exposing B cells to 1 µM bisindolylmaleimide I (Bis I), an isozyme non-selective
PKC inhibitor, prevented the glucose-induced suppression of A
1-AR
(
Fig. 4). A similar result was observed with Calphostin C, which is a
highly specific PKC inhibitor that competes at the diacylglicerol binding site
(
Fig. 5). This implies the involvement of conventional and/or novel PKC
isozymes. Treatment of B cells with a selective inhibitor of Ca
2+-dependent
PKC isozymes (Go 6976) had no effect on the A
1-AR
mRNA level, suggesting the involvement of novel PKCs. According to previous
reports, even at a micromolar concentration, Go 6976 has no effect on the Ca
2+-independent
PKC isozymes (13). Exposing B cells to Go 6983, an inhibitor of several PKC
isozymes (with the exception of PKC-µ), effectively blocked the high glucose
effect on A
1-AR expression. The glucose effect
on A
1-AR expression was also abolished by rottlerin
(10 µM), a selective inhibitor of PKC-

and PKC-

(
Fig.
5).
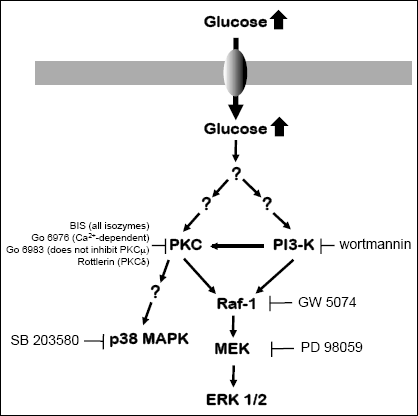 |
Fig. 3. Schematic sketch depicting potential signaling cascade transmitting the high glucose signal. The exact mechanism by which high glucose activates PKC and PI3-K remains undefined. The target for each pharmacological inhibitor is indicated. Abbreviations are described in the text. |
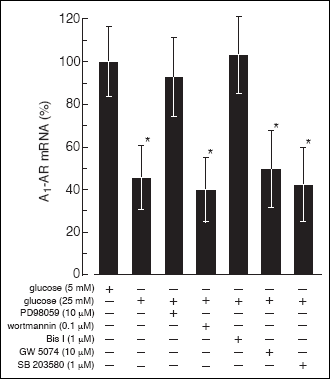 |
Fig. 4. The effect of PI3-K,
Raf-1, MEK, p38 MAPK, and PKC inhibitors on high glucose-induced suppression
of the A1-AR mRNA level in rat B lymphocytes.
The cells were cultured in RPMI medium containing 5 mM glucose for 20
hours and then for 24 hours in medium containing 25 mM glucose. One hour
before raising the glucose concentration to the culture medium examined
inhibitors were added at indicated concentrations. Next the cells were
harvested and the A1-AR mRNA was quantified
as described under "Materials and Methods". To the control cells appropriate
volume of solvent (DMSO) was added. The data represent the mean ±SD from
four experiments. (*) P<0.05 versus 5 mM glucose. |
 |
Fig. 5. The effect of PKC
inhibitors on high glucose-induced suppression of the A1-AR
mRNA level in rat B lymphocytes. The cells were cultured in RPMI medium
containing 5 mM glucose for 20 hours and then for 24 hours in medium containing
25 mM glucose. One hour before raising the glucose concentration to the
culture medium examined inhibitors were added at indicated concentrations.
Next the cells were harvested and the A1-AR
mRNA was quantified as described under "Materials and Methods". To the
control cells appropriate volume of solvent (DMSO) was added. The data
represent the mean ±SD from four experiments. (*) P<0.05 versus 5 mM glucose. |
The high glucose effect on A2B-AR expression in rat B lymphocytes
Exposing rat B lymphocytes to an increased concentration of glucose resulted
in a decrease of the A
2B-AR transcript level.
The maximal effect of 25 mM glucose (a 60% decrease) was seen at the 48
th
hour incubation of the cells (
Fig. 6). Exposing the B cells to high glucose
in the presence of wortmannin (0.1 µM) did not affect the glucose action on
the A
2B-AR transcript level, implying that PI3-K
is not involved. Pretreatment of the cells with GW 5074 (10 µM), or PD 98059
(10 µM) resulted in suppression of the glucose effect on A
2B-AR
mRNA level (
Fig. 7). This indicates that high glucose-induced A
2B-AR
downregulation is mediated
via activation of the Raf-1/MAPK/ERK pathway.
Incubation of the cells with a p38 MAPK inhibitor (SB 203580) for 1 hour before
the exposure to 25 mM glucose had no effect on the glucose action on the A
2B-AR
mRNA level. Inclusion of 1 µM Bis I in the incubation medium completely prevented
the glucose-induced suppression of A
2B-AR expression
(
Fig. 7). To determine the role of PKC isoforms in the glucose signaling
cascade, the association of a particular PKC isoform with the downregulation
of A
2B-AR was assessed by the use of several
specific inhibitors. As shown in
Fig. 8, pretreatment of the cells with
a selective inhibitor of Ca
2+-dependent PKCs (Go
6976) did not affect the glucose action on the A
2B-AR
transcript level. The presence of another PKC inhibitor (Go 6983), which is
not effective in inhibiting PKC-µ isoform, prevented the glucose action on A
2B-AR
mRNA level. The suppression of A
2B-AR expression
evoked by high glucose was also affected by neither the PKC-

and PKC-

inhibitor
(Rottlerin) nor the PKC-

inhibitor (myristoylated pseudosubstrate peptide).
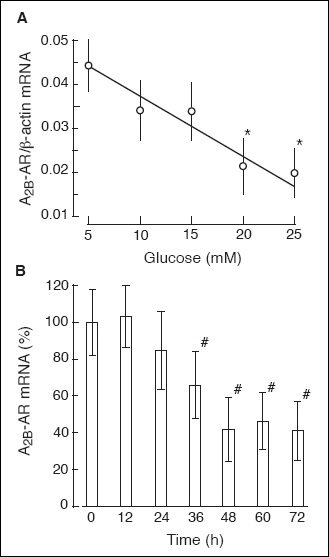 |
Fig. 6. The glucose effect
on the abundance of A2B-AR mRNA in rat
B lymphocytes. (A) Dose-dependent course of glucose action on the
A2B-AR mRNA level. Cells were cultured
for 48 hours in the presence of glucose at the concentrations indicated.
Next, cells were harvested, total RNA was extracted, and the A2B-AR
mRNA level was determined as described under "Materials and Methods".
The data represent the mean ±SD from three experiments. (*) P<0.05 versus
5 mM glucose. (B) Time course of glucose action on the A2B-AR
mRNA level. Cells were cultured in the presence of 5 mM glucose for 20
hours. On the second day (time 0) cells were transferred to the culture
medium containing 25 mM glucose. At time indicated, cells were harvested
and the A2B-AR mRNA level was determined
as described above. The data represent the mean ±SD from three experiments.
(*) P<0.05 versus 0 time. |
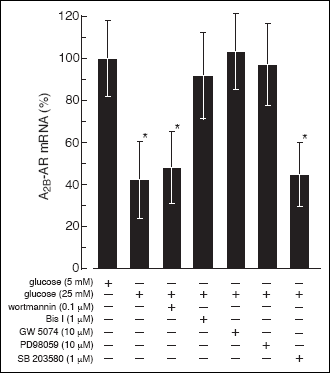 |
Fig. 7. The effect of PI3-K,
Raf-1, MEK, p38 MAPK, and PKC inhibitors on high glucose-induced suppression
of the A2B-AR mRNA level in rat B lymphocytes.
The cells were cultured in RPMI medium containing 5 mM glucose for 20
hours and then for 48 hours in medium containing 25 mM glucose. One hour
before raising the glucose concentration to the culture medium examined
inhibitors were added at indicated concentrations. Next the cells were
harvested and the A2B-AR mRNA was quantified
as described under "Materials and Methods". To the control cells appropriate
volume of solvent (DMSO) was added. The data represent the mean ±SD from
four experiments. (*) P<0.05 versus 5 mM glucose. |
 |
Fig. 8. The effect of PKC
inhibitors on high glucose-induced suppression of the A2B-AR
mRNA level in rat B lymphocytes. The cells were cultured in RPMI medium
containing 5 mM glucose for 20 hours and then for 48 hours in medium containing
25 mM glucose. One hour before raising the glucose concentration to the
culture medium examined inhibitors were added at indicated concentrations.
Next the cells were harvested and the A2B-AR
mRNA was quantified as described under "Materials and Methods". Where
it was necessary to the control cells appropriate volume of solvent (DMSO)
was added. The data represent the mean ±SD from four experiments. (*)
P<0.05 versus 5 mM glucose. |
The high glucose effect on A3-AR expression in rat B lymphocytes
Rat B lymphocytes incubated at an increased concentration of glucose displayed
decreased level of A
3-AR mRNA. Examination of
the glucose dose response effect of A
3-AR expression
revealed that the maximal effect could be observed at ~20 mM glucose (
Fig.
9A). The maximal effect of 25 mM glucose (~50% decrease) was observed at
the 48
th hour of the cells' incubation (
Fig.
9B). The glucose effect on A
3-AR expression
was blocked by neither the PI3-K inhibitor (wortmannin) nor the MAPK inhibitors
(GW 5074, PD98059, SB 203580). However, pretreatment of the cells with 1 µM
Bis I resulted in suppression of the high glucose effect on A
3-AR
expression, implying the involvement of PKC (
Fig. 10). To further examine
the hypothesis that A
3-AR expression in rat
B lymphocytes is affected by high glucose in a PKC-dependent manner we used
other inhibitors that selectively inhibit PKC isoforms. Inhibition of PKC-

and PKC-

with Rottlerin
or PKC-

with myristoylated pseudosubstrate peptide, had no effect on high glucose-induced
suppression of A
3-AR expression. However, the
addition of a selective inhibitor of Ca
2+-dependent
PKC isoforms (Go 6976) to the incubation medium prevented the high glucose effect
on A
3-AR expression (
Fig. 11).
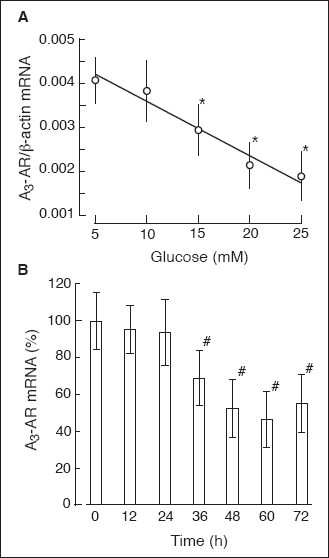 |
Fig. 9. The glucose effect
on the abundance of A3-AR mRNA in rat
B lymphocytes. (A) Dose-dependent course of glucose action on the
A3-AR mRNA level. Cells were cultured
for 48 hours in the presence of glucose at the concentrations indicated.
Next, cells were harvested, total RNA was extracted, and the A3-AR
mRNA level was determined as described under "Materials and Methods".
The data represent the mean ±SD from three experiments. (*) P<0.05 versus
5 mM glucose. (B) Time course of glucose action on the A3-AR
mRNA level. Cells were cultured in the presence of 5 mM glucose for 20
hours. On the second day (time 0) cells were transferred to the culture
medium containing 25 mM glucose. At time indicated, cells were harvested
and the A3-AR mRNA level was determined
as described above. The data represent the mean ±SD from three experiments.
(*) P<0.05 versus 0 time. |
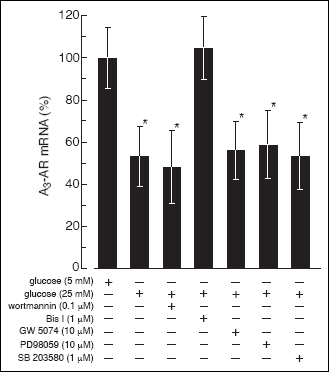 |
Fig. 10. The effect of PI3-K,
Raf-1, MEK, p38 MAPK, and PKC inhibitors on high glucose-induced suppression
of the A3-AR mRNA level in rat B lymphocytes.
The cells were cultured in RPMI medium containing 5 mM glucose for 20
hours and then for 48 hours in medium containing 25 mM glucose. One hour
before raising the glucose concentration to the culture medium examined
inhibitors were added at indicated concentrations. Next the cells were
harvested and the A3-AR mRNA was quantified
as described under "Materials and Methods". To the control cells appropriate
volume of solvent (DMSO) was added. The data represent the mean ±SD from
four experiments. (*) P<0.05 versus 5 mM glucose. |
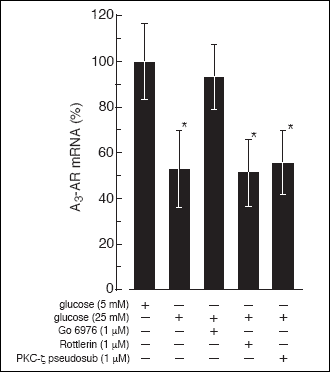 |
Fig. 11. The effect of PKC
inhibitors on high glucose-induced suppression of the A3-AR
mRNA level in rat B lymphocytes. The cells were cultured in RPMI medium
containing 5 mM glucose for 20 hours and then for 48 hours in medium containing
25 mM glucose. One hour before raising the glucose concentration to the
culture medium examined inhibitors were added at indicated concentrations.
Next the cells were harvested and the A3-AR
mRNA was quantified as described under "Materials and Methods". Where
it was necessary to the control cells appropriate volume of solvent (DMSO)
was added. The data represent the mean ±SD from four experiments. (*)
P<0.05 versus 5 mM glucose. |
DISCUSSION
The presence of all four adenosine receptor (AR) types on immune cells has been reported previously (5), although information about the ARs expression pattern on particular lymphocyte subtype is incomplete. In most cases, the expression of a particular AR type was inferred from studies using specific pharmacological ligands. Investigation performed on human peripheral lymphocytes has documented the presence of A
2A-AR protein in functional subsets of peripheral T cells, but failed to detect this protein in B cells (18). Expression of mRNA for all four ARs has been reported in mice B lymphocytes, but the ARs proteins were not investigated in that study (19). Our work shows that rat B lymphocytes express all four types of adenosine receptors at the mRNA and protein level, although the A
2A-AR and A
3-AR proteins were barely detectable.
Previously reported data indicate that the development of diabetes results in an altered expression of adenosine receptors in a variety of cell types, including rat T lymphocytes (2, 9-11). However, regulation of adenosine receptors in B cells had not yet been studied in relation to changes in glucose concentration. Our study, performed on cardiac fibroblasts, documented that changes in the glucose level have a significant impact on ARs expression (20); however, the signaling pathways utilized by glucose to regulate ARs expression was not investigated. In the present study, we demonstrate that in rat B cells high glucose suppresses the expression of A
1AR, A
2B-AR, and A
3-AR in a PKC-dependent manner, but does not affect the expression level of A
2A-AR.
The high glucose effects on PKC expression and activity have been studied using
the animal model of diabetes and in cultured cells (21, 22). Many investigators
have documented increased activity of different PKC isozymes in cells exposed
to high glucose (23-26). The involvement of PKC in the regulation of A
1-AR
expression in hamster ductus deferens tumor (DDT1MF-2) cells has been reported
recently (27). It has been demonstrated that the PKC-induced expression of A
1-AR
gene is mediated by NF-

B.
The PKC-depended NF-

B
activation required an increase in cellular Ca
2+
concentration, implying the involvement of conventional PKC isozymes. This assumption
supports the observation that B cells isolated from the PKC-ß-deficient
mice show a defect in NF-

B
activation (28). In our study, pretreatment of B cells with a Ca
2+-dependent
PKC inhibitor (Go6976) suppressed the high glucose effect on A
3-AR
mRNA expression, but had no effect on high glucose-induced suppression of A
1-AR
and A
2B-AR mRNA expression. This suggests the
involvement of conventional PKC isozymes in mediating the high glucose effect
on A
3-AR expression. Go6983, a potent inhibitor
of several PKC isozymes (though not PKC-µ), completely blocked the high glucose
effect on A
1AR and A
2BAR
expression. Pretreatment of B lymphocytes with rottlerin, reported to be a selective
inhibitor of PKC-

and PKC-

(14, 29),
abolished the high glucose effect on the expression of A
1-AR
mRNA, but has no effect on A
2B-AR expression.
Since B cells do not express the PKC-

(30, 31), it might be suggested that PKC-

is the principal PKC isozyme mediating the high glucose effect on A
1-AR
mRNA expression in rat B cells. The observation that the high glucose effect
on A
2B-AR expression was blocked by a nonselective
PKC inhibitor but was not affected by inhibitors of the Ca
2+-dependent
PKC isoforms, PKC-

and PKC-

might suggest that in rat B lymphocytes high glucose-induced suppression of
A
2B-AR expression requires the activity of some
novel PKC isoforms i.e. PKC-

or/and PKC-

.
It has been observed that exposure of primary cell cultures to high glucose
results in the elevation of the total mass of PKC-

,
-

,
-ßII, and -

(32-34). A significant increase of PKC-

was observed within 24 h of the cells exposure to high glucose, whereas PKC-

,
-ßII, and -

had increased by 48 h (34, 35). The timing of maximal suppressions of ARs expression
observed in our experiments correlates well with the induction of the appropriate
PKCs observed in the above mentioned studies. The exact mechanism whereby rat
B cell PKCs are activated by high glucose remains to be evaluated, although
it is possible that activation of the polyol pathway under high glucose concentration
leads to a
de novo synthesis of DAG, which in turn stimulates PKCs (35).
There is also a growing body of evidence regarding the activation of PKC by
high glucose-induced oxidative stress (36, 37).
The activation of the MAPK signaling pathways is perhaps the most common event
to be involved in a high glucose-mediated induction of PKC (33, 38, 39). PKC
is often found to be associated with this pathway at the level of Raf-1 kinase.
We have observed that inhibition of the Raf/MEK/ERK1/2 signaling cascade, at
the level of Raf-1, completely blocked the high glucose effect on A
2B-AR
expression, but had no effect on the expression of A
1-AR,
and A
3-AR. The suppression of A
2B-AR
evoked by high glucose was also abolished by an MAPK kinase (MEK) inhibitor
which is an upstream effector of ERK1/2. It has been reported that the same
PKC-

signaling pathways are associated with the activation of extracellular signal-regulated
kinases 1/2 (ERK1/2), and p38 mitogen-activated protein kinase (p38 MAPK) (40-42).
We observed that inhibition of A
1-AR expression
by high glucose was not prevented by the pretreatment of rat B lymphocytes with
an inhibitor of p38 MAPK; however, the MEK inhibitor suppressed the high glucose
effect on A
1-AR expression. This indicates that
high glucose suppresses expression of A
1-AR
in rat B cells by activating the PKC-

and MEK/ERK1/2 pathways. The involvement of PKC-

in activation of the Raf-1/MEK/ERK1/2 pathway has been reported (25, 43, 44).
However, in our study pretreatment, the B lymphocytes with an Raf-1, MEK or
p38 MAPK inhibitor (GW5074, PD98059, SB203580, respectively) has no effect on
high glucose-induced and PKC-

/ß
dependent suppression of A
3-AR expression.
In summary, our study has documented that in rat B lymphocytes, high glucose suppresses the expression of A
1, A
2B and A
3 adenosine receptors utilizing a different signaling pathway involving various protein kinase C isozymes, whereas the expression level of A
2A-AR is not affected by changes in glucose concentration. Therefore, it is possible that, in diabetes the A
2A-AR may become the predominant adenosine receptor on B cells. Previously, we have reported that T lymphocytes exposed to high glucose release the increased amount of adenosine (2). Thus, under high glucose conditions B cells might be more sensitive to suppression by the adenosine released from interacting T lymphocytes. These outcomes may be related to the impaired lymphocyte function observed in diabetes.
Acknowledgements:
This work was supported by The Polish Ministry of Science and High Education;
grant number: 2 P05A 081 29 to TP.
Conflict of interests: None declared.
REFERENCES
- Joshi N, Caputo GM, Weitekamp MR, Karchmer AW. Infections in patients with diabetes mellitus. N Engl J Med 1999; 341: 1906-1912.
- Sakowicz-Burkiewicz M, Kocbuch K, Grden M, Szutowicz A, Pawelczyk T. Diabetes-induced decrease of adenosine kinase expression impairs the proliferation potential of diabetic rat T lymphocytes. Immunology 2006; 118: 402-412.
- Nemeth ZH, Bleich D, Csoka B, et al. Adenosine receptor activation ameliorates type 1 diabetes. FASEB J 2007; 21: 2379-2388.
- Buckley RH. Molecular defects in human severe combined immunodeficiency and approaches to immune reconstitution. Annu Rev Immunol 2004; 22: 625-655.
- Hasko G, Cronstein BN. Adenosine: an endogenous regulator of innate immunity. Trends Immunol 2004; 25: 33-39.
- Jankowski M. Purinergic regulation of glomerular microvasculature and tubular function. J Physiol Pharmacol 2008; 59(Suppl 9): 121-135.
- Yegutkin GG. Nucleotide- and nucleoside-converting ectoenzymes: Important modulators of purinergic signaling cascade. Biochim Biophys Acta 2008; 1783: 673-694.
- Fredholm BB, Ijzerman AP, Jacobson KA, Klotz K-N, Linden J. International Union of Pharmacology. XXV. Nomenclature and classification of adenosine receptors. Pharmacol Rev 2001; 53: 527-552.
- Grden M, Pogorska M, Szutowicz A, Pawelczyk T. Altered expression of adenosine receptors in heart of diabetic rat. J Physiol Pharmacol 2005; 56: 587-597.
- Grden M, Podgorska M, Szutowicz A, Pawelczyk T. Diabetes-induced alterations of adenosine receptors expression level in rat liver. Exp Mol Phatol 2007; 83: 392-398.
- Pawelczyk T, Grden M, Rzepko R, Sakowicz M, Szutowicz A. Region-specific alterations of adenosine receptors expression level in kidney of diabetic rat. Am J Pathol 2005; 167: 315-325.
- Sakowicz-Burkiewicz M, Szutowicz A, Pawelczyk T. Differential effect of insulin and elevated glucose level on adenosine transport in rat B lymphocytes. Int Immunol 2004; 17: 145-154.
- Martiny-Baron G, Kazanietz MG, Mischak H, et al. Selective inhibition of protein kinase C isozymes by the indolocarbazole Go 6976. J Biol Chem 1993; 268: 9194-9197.
- Gschwendt M, Muller HJ, Kielbasa K, et al. Rottlerin, a novel protein kinase inhibitor. Biochem Biophys Res Commun 1994; 199: 93-98.
- Alessi DR, Cuenda A, Cohen P, Dudley DT, Saltiel AR. PD 098059 is a specific inhibitor of the activation of mitogen-activated protein kinase kinase in vitro and in vivo. J Biol Chem 1995; 270: 27489-27494.
- Davies SP, Reddy H, Caivano M, Cohen P. Specificity and mechanism of action of some commonly used protein kinase inhibitors. Biochem J 2000; 351: 95-105.
- Lackey K, Cory M, Davis R, et al. The discovery of potent cRaf1 kinase inhibitors. Bioorg Med Chem Lett 2000; 10: 223-226.
- Koshiba M, Rosin DL, Hayashi N, Linden J, Sitkovsky MV. Patterns of A2A extracellular adenosine receptor expression in different functional subsets of human peripheral T cells. Flow cytometry studies with anti-A2A receptor monoclonal antibodies. Mol Pharmacol 1999; 55: 614-624.
- Lukashev DE, Smith PT, Caldwell CC, Ohta A, Apasov SG, Sitkovsky MV. Analysis of A2A receptor-deficient mice reveals no significant compensatory increases in the expression of A2B, A1, and A3 adenosine receptors in lymphoid organs. Biochem Pharmacol 2003; 65: 2081-2090.
- Grden M, Podgorska M, Kocbuch K, Szutowicz A, Pawelczyk T. Expression of adenosine receptors in cardiac fibroblasts as a function of insulin and glucose level. Arch Biochem Biophys 2006; 455: 10-17.
- Mingzhang G, Wu MH, Korompai F, Yuan SY. Upregulation of PKC genes and isozymes in cardiovascular tissues during early stages of experimental diabetes. Physiol Genomics 2003; 12: 139-146.
- Rask-Madsen C, King GL. Proatherosclerotic mechanisms involving protein kinase C in diabetes and insulin resistance. Arterioscler Thromb Vasc Biol 2005; 25(4): 87-496.
- Whiteside CI, Dlugosz JA. Mesangial cell protein kinase C isozymes activation in the diabetic milieu. Am J Physiol Renal Physiol 2002; 282: F975-F980.
- Devaraj S, Venugopal SK, Singh U, Jialal I. Hyperglycemia induces monocytic release of interleukin-6 via induction of protein kinase C-a and -b. Diabetes 2005; 54: 85-91.
- Dasu MR, Devaraj S, Jialal I. High glucose induces IL-1b expression in human monocytes: mechanistic insights. Am J Physiol Endocrinol Metab 2007; 293: E337-E346.
- Lin H, Mitasikova M, Dlugosowa K, et al. N. Thyroid hormones suppress e-PKC signaling, down-regulate connexin-43 and increase lethal arrhythmia susceptibility in non-diabetic and diabetic rat hearts. J Physiol Pharmacol 2008; 59: 271-285.
- Jajoo S, Mukherjea D, Pingle S, Sekino Y, Ramkumar V. Induction of adenosine A1 receptor expression by pertussis toxin via an adenosine 5'-diphosphate ribosylation-independent pathway. J Pharamcol Exp Ther 2006; 317: 1-10.
- Saijo K, Mecklenbrauker I, Santana A, Leitger M, Schmedt C, Tarakhovsky A. Protein kinase C beta controls nuclear factor kappaB activation in B cells trough selective regulation of the IkappaB kinase alpha. J Exp Med 2002; 195: 1647-1652.
- Samokhin GP, Jirousek MR, Ways DK, Henriksen RA. Effects of protein kinase C inhibitors on thromboxane production by thrombin-stimulated platelets. Eur J Pharmacol 1999; 386: 297-303.
- Meller N, Altman A, Isakov N. New perspectives on PKCQ, a member of the novel subfamily of protein kinase C. Stem Cells 1998; 16: 178-192.
- Meller N, Elitzur Y, Isakov N. Protein kinase C-theta (PKCtheta) distribution analysis in hematopoietic cells: proliferating T cells exhibit high proportions of PKCtheta in the particulate fraction. Cell Immunol 1999; 193: 185-193.
- Koya D, Jirousek MR, Lin YW, Ishii H, Kuboki K, King GL. Characterization of protein kinase C b isoform activation on the gene expression of transforming grofth factor-b, extracellular matrix components, and prostanoids in the glomeruli of diabetic rats. J Clin Invest 1997; 100: 115-126.
- Igarashi M, Wakasaki H, Takahara N, et al. Glucose or diabetes activates p38 mitogen-activated protein kinase via different pathways. J Clin Invest 1999; 103: 185-195.
- Dlugosz JA, Munk S, Ispanovic E, Goldberg HJ, Whiteside CI. Mesangial cell filamentous-actin disassembly and hypocontractility in high glucose are mediated by protein kinase C-z. Am J Physiol Renal Physiol 2002; 282: F151-F163.
- Kapor-Drezgic J, Zhou X, Babozono T, Dlugosz JA, Hohman T, Whiteside C. Effect of high glucose on mesangial cell protein kinase C-d and -e is polyol pathway-dependent. J Am Soc Nephrol 1999; 10: 1193-1203.
- Tuttle K, Anderberg RJ, Cooney SK, Meek RL. Oxidative stress mediates protein kinase C activation and advanced glycation end product formation in a mesangial cell model of diabetes and high protein diet. Am J Nephrol 2008; 29: 171-180.
- Chai D, Wang B, Shen L, Pu J, Zhang XK, He B. RXR agonists inhibit high-glucose-induced oxidative stress by repressing PKC activity in human endothelial cells. Free Radic Med 2008; 44: 1334-1347.
- Lin S, Sahai A, Chugh SS, et al. High glucose stimulates synthesis of fibronectin via a novel protein kinase C, Rap 1b, and B-Raf signaling patway. J Biol Chem 2002; 277: 41725-41735.
- Xin X, Khan ZA, Chen S, Chakrabarti S. Extracellular signal-regulated kinase (ERK) in glucose-induced and endothelin-mediated fibronectin synthesis. Lab Invest 2004; 84: 1451-1459.
- Lomonaco SL, Kahana S, Blass M, et al. Phosphorylation of protein kinase Cd on distinct tyrosine residues induces sustained activation of Erk1/2 via down-regulation of MKP-1. Role in the apoptotic effect of etoposide. J Biol Chem 2008; 283: 17731-17739.
- Daniluk J, Dabrowski A. The effect of concomitant stimulation with cholecystokinin and epidermal growth factor on extracellular signal-regulated kinase (ERK) activity in pancreatic acinar cells. J Physiol Pharmacol 2007; 58: 441-453.
- Tanaka Y, Gavrielides MV, Mitsuuchi Y, Fujii T, Kazanietz MG. Protein kinase C promotes apoptosis in LNCaP prostate cancer cells through activation of p38 MAPK and inhibition of the Akt survival pathway. J Biol Chem 2003; 278: 33753-33762.
- Cheng J-J, Wung B-S, Chao Y-J, Wang DL. Sequential activation of protein kinase C (PKC)-a and PKC-e contributes to sustained Raf/ERK1/2 activation in endothelial cells under mechanical strain. J Biol Chem 2001; 276: 31368-31375.
- Mauro A, Ciccarelli C, De Cesaris P, et al. PKCa-mediated ERK, JNK and p38 activation regulates the myogenic program in human rhabdomyosarcoma cells. J Cell Sci 2002; 115: 3587-3599.


