Hypoxaemia is a frequent feature of numerous disorders of the circulatory system, especially those associated with ischaemic organ failure due to septicemia/endotoxemia (4, 19). These disorders are often associated with elevated plasma levels of cytokines, including IL-1ß and IL-6 (20). Bearing in mind the pathophysiologic relationship of hypoxia and anapyrexia, and possibly the other symptoms of sickness, and the involvement of cytokines and prostaglandins in the induction of sickness behaviour, the question arose as to whether these mediators contribute to the thermoregulatory changes upon hypoxia. In the present study we have tested the hypothesis that exposure to hypoxia alone can induce symptoms of sickness. Furthermore, we have examined a role of IL-6 and PGE2 in the induction of anapyrexia during hypoxaemia.
Animals and animal care
Following male mice from the Jackson Laboratories (Bar Harbor, ME) were used throughout the experiments: (1) specific-pathogen-free 6- to 7-wk-old Swiss Webster mice; (2) B6:129S2-Il6tm1Kopf/J (interleukin 6 deficient; IL-6-/-; stock number 002254) mice; (3) and control wild type (IL-6+/+) F2 generation of 129Sv(ev)/C57BL6 hybrid mice. Care and treatment of the mice were conducted as approved by the local Animal Care and Use Committee. All mice were kept in the specific pathogen-free facility. Mice were housed in individual plastic cages and maintained in a temperature/humidity/light-controlled chamber set at 28 ± 1°C, 12:12 h light:dark cycle, with light on at 06:00 h. Rodent laboratory chow and drinking water were provided ad libitum. One week after shipment, the mice were implanted under sterile conditions with biotelemetry devices to monitor body temperature and motor activity. Experiments were started after 7 days of post-surgery recovery. The mice were usually in their 9th week of age during the beginning of the experimentation.
Body temperature measurement
Deep body temperature (Tb) of the mice was measured with an accuracy of ± 0.1°C using battery operated miniature biotelemeters (model VMFH MiniMitter, Sunriver, OR) implanted intra-abdominally (for details see 21). Recordings were made at 5-min intervals using a peripheral processor (Dataquest III System) connected to an IBM personal computer.
Activity measurement
Motor activity of the mice was measured using the same biotelemetry system described above (see 21 for more detailed description). Briefly, in this system, changes in activity are detected by changes in position of the implanted transmitter over the receiver board. This results in a change in the signal strength that is detected by the receiver and recorded as a "pulse" or "count" of activity.
Body weight and food intake
These were monitored daily between 09:00 and 10:00 AM by weighing on a top-loading balance accurate to ± 0.1 g (Sartorius model MP 1206, Brinkman Instruments, Inc.). Accordingly, each weighing session resulted in termination of the experiment (exposure to hypoxia) for the particular set of animals. They were not re-exposed to hypoxia, and were eliminated from the experiment.
Exposure to hypoxia
Chronic hypoxic exposure was performed in homemade plexi-glass sealed chambers, each housing six regular plastic mouse cages. Cages were provided with exact amount of food and water, enough for duration of given experiment and equal for each mouse. The chamber was placed directly over six biotelemetry receivers. Six implanted mice were placed individually (one per cage) in a chamber. After sealing the chamber was connected to a gas-mixing pump (Digamix gas mixing pump, type M302/a-F, H. Wösthoff e.H.G., Bochum, Germany) and basal ventilation (5 l/min) was recorded at 21% O2 for 48 hours. Acute hypoxia was achieved by flushing air balanced in N2. The chamber oxygen concentration was reduced from room air to 11% O2 within 15 min and maintained under this condition for the time period indicated in figures.
LPS-induced systemic inflammation
LPS derived from Escherichia coli (0111:B4, Sigma Chemicals), a typical bacterial pyrogen and inducer of sickness behaviour used in the laboratory settings, was dissolved in sterile 0.9% sodium chloride (saline) at a stock concentration of 2 mg/ml and kept frozen (-20°C). Before use and dilution to desired concentration, a portion of the stock was preheated to 37°C and vortexed. LPS was injected intravenously (iv) into the tail vein at a dose of 80 µg/kg (ca. 2 µg/mouse) in a volume of 0.05 ml/mouse. Pyrogen-free saline was used for control injections. Mice were restrained and not anesthetized during the LPS and/or saline iv injections. Immediately after the injections, mice were placed in their home cages, and one group was exposed to hypoxia. Another group of the LPS-injected mice was exposed to normal air for the control.
In additional experiments, at termination of the exposure to hypoxemic condition, separate groups of mice were injected intraperitoneally with mepacrine (Sigma, lot no. II3H3287), an inhibitor of phospholipase A2, and indomethacin (Sigma, lot no. I-7378), inhibitor of cyclooxygenase. Mepacrine was dissolved in sterile saline and injected at a dose of 10 mg/kg. Indomethacin was injected at a dose of 5 mg/kg as an aqueous sodium solution in 0,01 M anhydrous sodium carbonate and (for details see 21). Male Swiss Webster mice ware used exclusively for all injections. All experimental manipulations, including initiation and termination of hypoxia exposures, weighing and treatment with agents were performed during lights-on between 09:00 and 10:00AM.
Plasma assays
At selected time-points (see figures) mice were anesthetized (inhaled isoflorane) and blood was collected via cardiac puncture into an ice-cold heparinized 1-ml syringe. Blood was immediately centrifuged, and plasma stored at -80°C until assay. Plasma IL-6 levels were determined by a standard sandwich ELISA kit from R&D Systems (Minneapolis, MN; cat. no. M6000; sensitivity of assay 3 pg/ml, range 15-1000 pg/ml). Colorimetric changes of enzyme substrates were detected at 450 nm wavelength, using a Bio-kineticks plate reader EL-312 (Bio-Tek Instruments). PGE2 levels were determined in duplicate using a highly sensitive colorimetric assay kit from R&D Systems (cat. no. SE0100; sensitivity assay 36.2 pg/ml, range 39-5000 pg/ml) according to the manufacture's instruction. Wells were read at 670 nm with a Bio-kineticks plate reader as above.
Data analysis
Values are reported as mean ± SE either for hourly averages or for 24 h averages of Tb and activity. Data were analyzed using Statview SE+Graphics (Abacus Concepts, Berkeley, CA). Analysis of variance (ANOVA) with repeated measures was used to determine differences among groups in patterns of temperature and motor activity changes over time. ANOVA followed by Scheffe pairwise comparisons was used to test for statistical differences among groups at individual time points. Changes in food intake, body weight, and plasma levels of IL-6 and PGE2 were analyzed by t test in addition to ANOVA. Differences were considered significant when P < 0.05.
Changes of body temperature, motor activity, food intake, and body mass in mice exposed to hypoxaemic air
Undisturbed male Swiss Webster mice kept at an ambient temperature of 28°C on a 12:12-h light:dark cycle and exposed to normal air revealed a rhythm in Tb that paralleled the rhythm in locomotor activity (Fig. 1; data on motor activity not shown). Overall, two phases of the rhythm in mice can be distinguished; a nighttime rise in Tb and activity and then a daytime fall in both variables. Computed mean Tb (12-h averages) were 37.71 ± 0.05 °C and 36.48 ± 0.06 °C for nighttime and daytime, respectively. Mice exposed to chronic hypoxia (11% O2) for 7 days, as shown in Fig. 1, decreased a daytime Tb within first 3-4 h of hypoxia to 33.28 ± 0.32 °C (1-h average of Tb at 4 h from the start of hypoxia), followed by a gradual increase in Tb and returning to a circadian rhythm during next days.
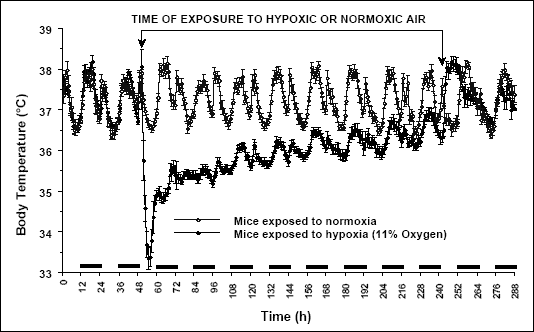 |
| Fig. 1. Changes of body temperature (°C) over time (h) of Swiss Webster mice under hypoxemic (11% O2; closed circles) and normal conditions (open circles). Two-day control recording proceeded exposure to a hypoxemic air. Mice were exposed to hypoxia for 7 days followed by returning to normal air. Black horizontal bars represent lights-off periods in a 12:12-h light-dark cycle. Values are means ± SE at 1-h averages; n = 18 mice per group. |
Fig. 2 demonstrates 24-h averages in Tb and motor activity of hypoxic and normoxic mice. As can be seen, during 7 days of exposure to hypoxaemic air the Tb of mice gradually increased from 35.36 ± 0.11 °C on day 1 to 36.43 ± 0.14 °C on day 7. Motor activity of hypoxic mice, on the other hand, after a significant drop from average daily activity of 440 ± 16 counts to 55 ± 8 counts (24-h average for 33 mice) on day 1 of hypoxia, remained almost unchanged until day 3 of hypoxia (88 ± 30 counts; computed average activity for 30 mice on day 3). Then it increased significantly on day 4 of hypoxia (to 206 ± 12 counts), and since then the hypoxic mice revealed the same level of daily activity until day 7 (215 ± 28 counts; computed average activity for 18 mice on day 7 of hypoxia).
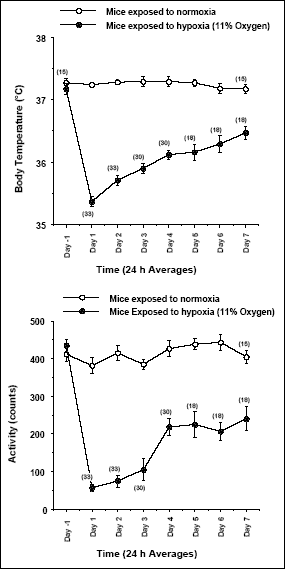 |
Fig. 2. Changes of body temperature (upper panel) and motor activity (lower panel) in Swiss Webster mice exposed for 7 days to hypoxemic air (11% O2; closed circles) and normal air (open circles). Data represent 24-h averages. Values are means ± SE; sample sizes are indicated between parentheses. |
Exposure to hypoxia provoked a significant suppression in feeding and loss in body mass of mice (Fig. 3). After dramatic drop on day 1 of hypoxia (from 3.98 ± 0.2g to 0.26 ± 0.1g), feeding increased gradually during the following 2 days (to 1.2 ± 0.22g on day 3 of hypoxia; P < 0.05 between day 1 and 3). Similar to the change in motor activity between day 3 and 4 of hypoxia (described above), food intake of hypoxic mice also displayed marked increase in this particular period (to 3.1 ± 0.4g on day 4 of hypoxia). During the following days, however, the food intake remained at the same level in mice exposed to hypoxic air (2.84 ± 0.12g on day 7 of hypoxia).
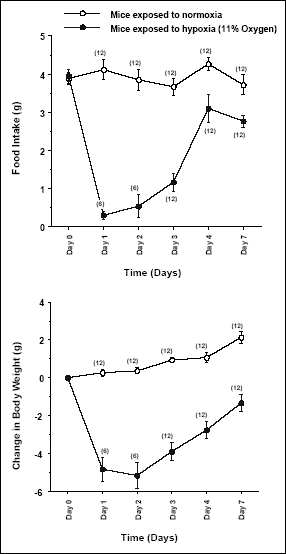 |
Fig. 3. Food intake (upper panel) and change in body weight (lower panel) of Swiss Webster mice exposed for 7 days to hypoxia (11% O2; closed circles) and normal air (open circles). Values are means ± SE; sample sizes are indicated between parentheses. |
Significant loss of body weight of hypoxic mice was recorded during the first two days of exposure. After that, the mice revealed a steady gaining of the body mass (Fig. 3). As can be seen in Fig. 3, a daily increases of body weight where larger in increments in hypoxia-exposed mice than that monitored for normoxic mice.
Prompt elevation of body temperature in hypoxic mice at the termination of exposure
Monitoring of Tb in freely moving mice by means of telemetry, and the design of the experiments rendering for a smooth adjustment of the O2 content in breathing air to normal level without disturbing the mice, allowed us to record a specific, rapid elevation of Tb in mice at the termination of the exposure to hypoxia. Termination of the exposure in reported experiments occurred always during daytime at 9:30 AM. During the following hours of the lights-on, the Tb of post-hypoxic mice breathing normal air remained significantly higher than daytime Tb of normoxic (control) mice (see Fig. 1; this effect can also be seen in Figs 7, 8 and 9).
Effect of hypoxia on plasma IL-6 and PGE2 levels
Results of plasma IL-6 levels in hypoxic and normoxic Swiss Webster mice are presented in Fig. 4. It can be seen that exposure to hypoxia provoked a significant elevation of circulating IL-6 compared to normoxic mice. Significantly higher level (P < 0.05) of IL-6 was noted already at 6 h of hypoxia exposure, and this trend continued till the end of the experiment, i.e., until day 7 of exposure. Plasma PGE2 levels, on the other hand, did not reveal any changes during exposure of the mice to a hypoxaemic air (data not shown). Blood contents of the PGE2 in hypoxic and normoxic mice were essentially the same throughout the duration of the experiment.
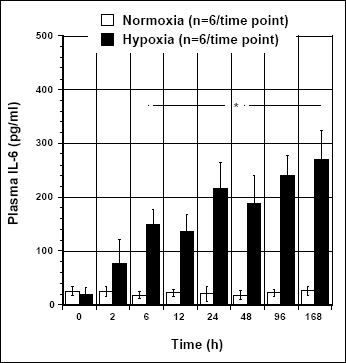 |
Fig. 4. Changes of plasma IL-6 levels (pg/ml) over time (h) of Swiss Webster mice exposed to hypoxia (11% O2; closed bars) and normal air (open bars). Values are means ± SE; n = 6/group for each time point. Asterisk indicates significant difference (P < 0.05) in plasma IL-6 contents between hypoxic and normoxic mice. |
As was mentioned in the Introduction section, both IL-6 and PGE2 are considered key mediators in generation of fever, especially a fever in response to endotoxin. Therefore, in the next set of experiments we have examined whether the hypoxia exposure can modulate an induction of IL-6 and PGE2 by LPS, a fever-inducing compound of gram-negative bacteria. Mice were injected intravenously with LPS, and the one group was exposed to normoxic air while the other to hypoxia (Fig. 5). LPS-treated normoxic mice developed a fever. Mice injected with LPS and then exposed to hypoxia, however, responded with significant drop of Tb, far more profound than that seen in hypoxic mice treated with saline as control. Six hours post-injections, mice shown in Fig. 5 were sacrificed for blood sampling and IL6 and PGE2 assays. As can be seen, a profound drop of Tb in mice treated with LPS and exposed to hypoxia was accompanied by a significant enhancement of the IL-6 production (Fig. 6; upper panel). Surprisingly, however, exposure to hypoxia arrested the PGE2 production in mice treated with LPS (Fig. 6; lower panel). In the following study we examined, therefore, whether IL-6 may contribute to the anapyrexia upon hypoxia.
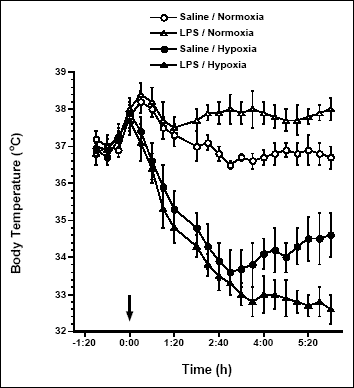 |
Fig. 5. Effect of injection of LPS (80 µg/kg; triangles) and/or saline (circles) on changes of body temperature in Swiss Webster mice under hypoxemic (11% O2; closed symbols) and normal conditions (open symbols). Twelve mice were injected at 09:00 AM (time 0; arrow) either with LPS or with saline and half of the respective group were exposed to hypoxia. Values are means ± SE at 20-min averages; n = 6 mice per group. |
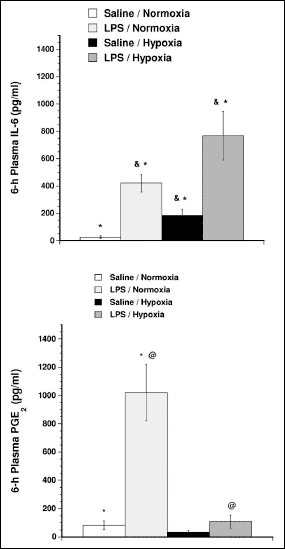 |
Fig. 6. Changes of plasma IL-6 (upper panel) and PGE2 (lower panel) levels of mice injected with LPS and saline as control, and then exposed for 6 hours to hypoxia or normoxia as shown in Fig. 5. Values are means ± SE; n = 6 mice per group. Symbols represent significant differences (P < 0.05) between groups as indicated. |
IL-6 deficient (IL-6 KO) mice respond with reduced anapyrexia to hypoxia
Genetically engineered mice deficient for IL-6 constitute a practical model to study a role of this cytokine during physiological and pathological responses to endogenous and exogenous stimuli. IL-6 KO and wild type control mice exposed to hypoxeamic conditions responded likewise with a decrease in Tb (Fig. 7). However, the drop of Tb in IL-6 KO mice during 48-h exposure to hypoxia was significantly reduced compared to that of monitored for wild type mice. Lack of IL-6 had no effect on the hypoxia-provoked decrease in motor activity (decrease in activity was essentially the same in IL-6 KO and wild type mice during exposure; data not shown). Furthermore, the lack of IL-6 had no effect on the rapid rise in Tb seen after termination of the exposure to hypoxia (Fig. 7).
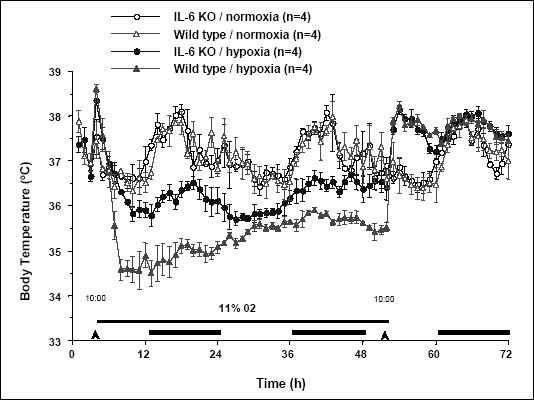 |
| Fig. 7. Changes of body temperature (°C) over time (h) of IL-6 deficient (IL-6 KO; circles) and wild type (control; triangles) C57BL6 mice exposed to hypoxia (11% O2; closed symbols) and to normal air (open symbols). Mice were exposed to hypoxia for 48 h followed by returning to normal air. Continuous horizontal line between arrowheads indicates time of the exposure to hypoxia. Black horizontal bars represent lights-off periods in a 12:12-h light-dark cycle. Values are means ± SE at 1-h averages; n = 4 mice per group. |
Involvement of phospholipase A2 and cyclooxygenase in rapid elevation of body temperature in hypoxic mice at the termination of exposure
To test whether phospholipase A2 (PLA2) and cyclooxygenases (COX) participate in the elevation of Tb at the termination of the exposure to hypoxia, we have treated mice with inhibitors of the respective enzyme at doses, which inhibited the LPS-induced fever in mice in our previous study (21). Mepacrine, an inhibitor of PLA2, given into mice at the moment of termination of hypoxia, did not influence a prompt rise in Tb (Fig. 8). Indomethacin, a potent inhibitor of COX-1 and COX-2, on the other hand, inhibited the rise in Tb subsequent to the termination of the exposure to hypoxia (Fig. 9). It also affected the process of returning to normal circadian rhythm of Tb in the post-hypoxic mice.
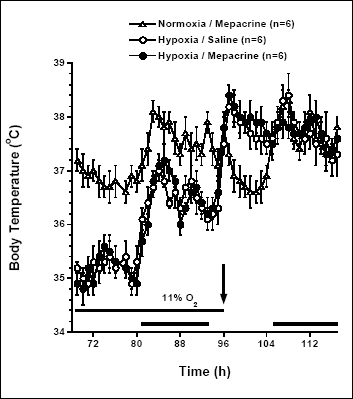 |
Fig. 8. Changes of body temperature of Swiss Webster mice exposed for 96 h to hypoxemic (11% O2; circles) and normal conditions (open triangles). At the termination of the exposure (arrow), groups of mice were injected with mepacrine (10 mg/kg) and/or saline (control) as indicated. Black horizontal bars represent lights-off periods in a 12:12-h light-dark cycle. Values are means ± SE at 1-h averages; sample sizes are shown between parentheses (note: presented graph demonstrates Tb data of the last 27 hrs of the exposure, and the following day). |
 |
Fig. 9. Changes of body temperature of Swiss Webster mice exposed for 96 h to hypoxemic (11% O2; circles) and normal conditions (open triangles). At the termination of the exposure (arrow), mice were injected with indomethacin (5 mg/kg) and/or control vehicle as indicated. Black horizontal bars represent lights-off periods in a 12:12-h light-dark cycle. Values are means ± SE at 1-h averages; sample sizes are shown between parentheses (note: presented graph demonstrates Tb data of the last 27 hrs of the exposure, and the following 3 days). |
Effect of indomethacin on the post-hypoxic changes in Tb prompted an assumption that prostaglandins are generated during recovery of the mice from chronic hypoxia to breath normal air. Fig. 10 demonstrates that indeed, within 1 h post-hypoxia there is a significant elevation of plasma PGE2 in the recovering mice.
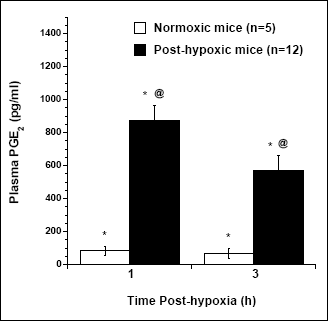 |
Fig. 10. Changes in plasma PGE2 levels in mice at 1 and 3 h post-hypoxia (closed bars) and normoxic mice (open bars). Values are means ± SE; n depicts sample sizes for each time point. Symbols represent significant differences (P < 0.05) between groups as indicated. |
The main result of the present study is that hypoxia in mice can induce anorexia and cachexia, and provoke a decrease in body temperature and motor activity. Anorexia and cachexia can also be induced by cytokines (8, 9), and infectious bacterial-origin agents such as LPS (21). It is generally thought that cytokines mediate these symptoms during a response to infection (9).
In our study, the mice exposed to chronic hypoxia display a gradual regaining in all behavioural symptoms measured, after a dramatic depression associated with an initial response to a decrease in O2 content in breading air. To some extent it resembles the response of mice to the septic-like doses of LPS (21), and to inflammatory agents directly affecting the lungs (4). Mice treated with high doses of LPS, in addition to anorexia, cachexia and lethargy, respond with a drop in body temperature, rather than with a fever. They also respond with anapyrexia to influenza pneumonitis. These effects appeared to be partially mediated by IL-6 (10, 22). In our present report, we observed that blood of mice exposed to chronic hypoxia contained the elevated levels of IL-6 (Fig. 4). Furthermore, a greater drop in body temperature in hypoxemic mice treated with LPS was associated with even greater production of IL-6. It suggests an involvement of IL-6 in anapyrexia upon hypoxia in these mice. Indeed, the exposure to hypoxia of IL-6 KO mice confirmed that IL-6 partially mediates anapyrexia due to hypoxia.
IL-6 is regarded as one of the endogenous pyrogens, i.e., factors mediating fever (11). Taking into consideration these effects, the question arises respecting a dual action of IL-6: what controlling factor accounts for a switching the thermoregulatory action of IL-6 from fever to anapyrexia? This question refers mainly to the thermoregulatory response because the other symptoms of sickness are equally present regardless of the switch in the thermoregulatory action of IL-6. Although the answer, due to lack of additional data is highly speculative, we do believe that this factor might be an O2, i.e., its partial pressure in the breathing air, and its contents in the key tissues sensitive to the minute changes in O2 saturation, such as nervous and endocrine cells, cardiac muscle, lungs, and kidney tissue, among others. Under normoxic conditions and during typical infections, IL-6 acts as an endogenous pyrogen. Whereas under hypoxic conditions, e.g., due to disorders affecting O2 saturation and impairing the gasses exchange in tissues, such as during severe infections (modeled by a septic-like dose of LPS), the cytokine acts as a mediator of anapyrexia. We assume that O2 represents a control variable, or one of the control variables, in this complex pathophysiological regulation.
IL-6 is a regulatory factor involved in the rapid (alarm-type) elevation of natural defense reactions such as synthesis of the acute phase proteins in liver, activation of the hypothalamo-pituitary-adrenal axis, synthesis of other cytokines (5, 23). Thus, IL-6 plays a fundamental role in orchestration of the responses of the organism to stressful environmental insults, such as infection and trauma. IL-6 provokes, or mediates most of these responses via the induction of generation of PGE2 (5, 11). Our data demonstrate the IL-6 can also be involved in stress due to a shortage in breathing O2. During chronic hypoxia, however, we were unable to record any changes in plasma levels of PGE2 in mice. Moreover, although LPS is a potent activator of the PGE2 generation under normal conditions in vivo (24, 25) and in vitro (26), in the hypoxic mice there was no elevation in PGE2 following treatment with LPS.
Exposure to hypoxia prevented the synthesis of PGE2 in mice. However, post-hypoxic re-oxygenation induced a significant elevation of plasma PGE2 (Fig. 10), paralleled with the rapid increase of Tb. According to our data using IL-6 KO mice (Fig. 7) it is clear, that this increase of Tb was not dependent on IL-6. It was also not affected by the inhibition of PLA2, an enzyme responsible for a liberation of arachidonic acid from membrane phospholipids, mostly microsomal membranes, providing a substrate for cyclooxygenases, which, under normal conditions, converts the arachidonic acid into prostaglandins, including PGE2. Inhibition of COX using indomethacin resulted in an abrogation of the post-hypoxic elevation in Tb, and in impairment of the mechanisms prompting a returning to normal circadian rhythm of mice. There are several possible explanations of these puzzling data. Although it is hypothetical, one possibility is that under hypoxic conditions the PLA2 is active to liberate arachidonic acid while COX is inactive, and, therefore, the synthesis of PGE2 is arrested. As a result of this lack of balance in the enzymes activation, the arachidonic acid may be accumulated in the microsomal membranes, which may allow the animals to adapt to the chronic hypoxic conditions. The elevated levels of IL-6 may, at least in part, accounts for the activation of PLA2 under hypoxia, since it has well been documented that the cytokine is a potent activator of PLA2 (27). Re-oxygenation (i.e., termination of the exposure to hypoxia), may lead to an instant activation of COX, and to a rapid release of PGE2 formed from the accumulated free arachidonic acid. As a result of this burst in the PGE2 formation, Tb of the animal increases, resembling a fever. We presume, accordingly, that the ability to a rapid clearance of the free arachidonic acid from microsomal membranes allows the animal for an undisturbed regaining of circadian rhythm upon re-exposure to the normal air. To better understand the physiological strategies underlying the adaptation to chronic hypoxia, a biological significance of symptoms of the sickness behavior under hypoxic conditions, and the mechanisms associated with re-adaptation to normoxia, this study needs continuation.
Acknowledgements: This study was supported in part by Nicolaus Copernicus Intramural Grant 513-B, and by the European Commission Grant 006152 to W. Kozak.
- Dantzer R, Kelley KW. Stress and immunity: An integrated view of relationship between the brain and the immune system. Life Sci 1989; 44: 1995-2008.
- Kluger MJ. Fever: Role of pyrogens and cryogens. Physiol Rev 1991; 71: 93-127.
- Hart BL. The behavior of sick animals. Vet Clin North Am Small Anim Pract 1991; 21: 225-237.
- Kozak W. Regulated decreases of body temperature. In Fever: Basic Mechanisms and Management. PA Mackowiak (ed). Philadelphia - New York, Lippincott-Raven, 1997, pp. 467-478.
- Koj A. Initiation of acute phase response and synthesis of cytokines. Biochim Biophys Acta 1996; 1317: 84-94.
- Kluger MJ, Kozak W, Conn CA, Leon LR, Soszynski D. The adaptive value of fever. Infect Dis Clin N Am 1996; 10: 1-20.
- Krueger JM, Majde JA. Microbial products and cytokines in sleep and fever regulation. Crit Rev Immunol 1994; 14: 355-379.
- Plata-Salaman CR. Cytokines and ingestive behavior: Methods and overview. Methods Neurosci 1993; 17: 151-168.
- Swiergiel AH, Smagin GN, Johnson LJ, Dunn AJ. The role of cytokines in the behavioral responses to endotoxin and influenza virus infection in mice: effects of acute and chronic administration of the interleukin-1-receptor antagonist (IL-1ra). Brain Res 1997; 776: 96-104.
- Kozak W, Poli V, Soszynski D, Conn CA, Leon LR, Kluger MJ. Sickness behavior in mice deficient in interleukin-6 during turpentine abscess and influenza pneumonitis. Am J Physiol 1997; 272: R621-R630.
- Kozak W, Kluger MJ, Soszynski D, et al. IL-6 and IL-1b in fever: Studies using cytokine-deficient (knockout) mice. Ann NY Acad Sci 1998; 856: 33-47.
- Blatteis CM, Li S, Li Z, Feledr C, Perlik V. Cytokines, PGE2 and endotoxin fever: a re-assessment. Prostagl Lipid Mediat 2005; 76: 1-18.
- IUPS Thermal Commission. Glossary of terms for thermoregulation. Jap J Physiol 2001; 51: 245-280.
- Wood SC, Gonzales R. Hypothermia in hypoxic animals: Mechanism, mediators, and functional significance. Comp Biochem Physiol 1996; 113B: 37-44.
- Gordon CJ, Fogelson L. Comparative effects of hypoxia on behavioral thermoregulation in rats, hamsters, and mice. Am J Physiol 1991; 29: R120-R125.
- Dupre RK, Owen TL. Behavioral thermoregulation by hypoxic rats. J Exp Zool 1992; 262: 230-235.
- Clark DJ, Fewell JE. Decrease body-core temperature during acute hypoxemia in guinea pigs during postnatal maturation: a regulated thermoregulatory response. Can J Physiol Pharmacol 1996; 74: 331-336.
- Gordon CJ. The role of behavioral thermoregulation as a thermoeffector during prolonged hypoxia in the rat. J Therm Biol 1997; 22: 315-324.
- Bell RC, Coalson JJ, Smith JD, Johanson WG Jr. Multiple organ system failure and infection in adult respiratory distress syndrome. Ann Intern Med 1983; 99: 293-298.
- Fong Y, Moldawer LL, Marano M, et al. Endotoxemia elicits increased circulation beta 2-IFN/IL-6 in man. J Immunol 1989: 142: 2321-2329.
- Kozak W, Conn CA, Kluger MJ. Lipopolysaccharide induces fever and depresses locomotor activity in unrestrained mice. Am J Physiol 1994; 266: R125-R135.
- Chen W, Havell EA, Gigliotti F, Harmsen AG. Interleukin-6 production in a murine model of Pneumocystis carinii pneumonia: relation to resistance and inflammatory response. Infect Immun 1993; 1: 97-102.
- Hirano T. Interleukin 6 and its receptor: ten years later. Intern Rev Immunol 1998; 16: 249-284.
- Kozak W, Mayfield KP, Kozak A, Kluger MJ. Proadifen (SKF-525A), an inhibitor of cytochrome P-450, augments LPS-induced fever and exacerbates prostaglandin-E2 levels in the rat. J Thermal Biol 2000; 25: 45-50.
- Kozak W, Wrotek S, Kozak A. Pyrogenicity of CpG-DNA in mice: role of interleukin-6, cyclooxygenases, and nuclear factor-kB. Am J Physiol 2006; 290: R871-R880.
- Kozak W, Aronoff DM, Boutaud O, Kozak A. 11,12-epoxyeicosatrienoic acid attenuates synthesis of prostaglandin E2 in rat monocytes stimulated with lipopolysaccharide. J Exp Biol Med 2003; 228: 786-794.
- Cox G, Gauldie J. Interleukin-6. In Cytokines in Health and Disease, DG Remick, JS Friedland JS (ed), New York, Marcel Dekker, 1997, pp. 81-99.