IMMUNOMODULATORY EFFECT OF RIBOFLAVIN DEFICIENCY AND ENRICHMENT - REVERSIBLE PATHOLOGICAL RESPONSE VERSUS SILENCING OF INFLAMMATORY ACTIVATION
INTRODUCTION
Vitamins, which are an important component of our diet, are also essential factors for the proper functioning of the immune system (1). The deficiency of selected vitamins could affect the induction of proper innate as well as adaptive immune responses and consequently result in enhanced susceptibility to infection. For example, the deficiency of vitamin B6, which is important for the proper functioning of the T helper 1 (Th1) response, leads to the promotion of a T helper 2 (Th2) response. The deficiency of folate or B12 vitamin, which are important for the proper functioning of cellular immunity, e.g., response of natural killer (NK) cells, results in decreased cytotoxic activity of the immunocompetent cells (1). However, studies with regard to the effects of riboflavin (vitamin B2) on the course of the immune response in deficiency states or low-dose supplementation are limited. Riboflavin deficiency is a common problem concerns not only developing countries, where a high prevalence of B2 deficiency may occur as a result of poor diet, but also affluent countries such as the USA or the UK (2). The importance and commonness of this aspect was emphasized by Powers et al. (2) who reported that riboflavin deficiency was identified in 41% of elderly people and 95% of adolescent girls in the UK. Furthermore, Subramanian et al. (3) reported that vitamin B2 deficiency ranged from 15% to 50% among alcohol abusers. Pregnant women are also particularly vulnerable to the development of the state of riboflavin deficiency (4, 5).
The typical symptoms of riboflavin deficiency, described as oro-oculo-genital syndrome, occur about 3 – 5 months after the initiation of a riboflavin-deficient diet (6). Ariboflavinosis is manifested mainly by angular cheilosis, glossitis, pharyngitis, seborrheic dermatitis, photosensitivity (7), corneal opacity, lenticular cataracts, fatty degeneration of the kidney and liver, malabsorption of iron leading to the development of anemia (4), neurodegeneration (8), increased susceptibility to cancer development (9), especially esophageal cancer (10). This condition may also increase the susceptibility to development of preeclampsia in the pregnant women (5). Moreover, vitamin B2 deficiency impairs the proliferation of duodenum cells (11) and induces an inflammation of the mucus membrane (4), resulting in intensive oxidative stress in the intestinal cells (12). Isolated riboflavin deficiency is rarely noticed and is usually associated with a deficiency in other nutrients, including vitamins. Malabsorption, phototherapy of hyperbilirubinemia, or some medications such as chlorpromazine or borate can also result in ariboflavinosis (6). Bearing in mind the frequent occurrence of riboflavin deficiency, a study of riboflavin supplementation in instances of dietary deficiency, malabsorption, or riboflavin loss during therapy seems to be important. For example, strains of bacteria that overproduce riboflavin enable the production of riboflavin-enriched food that can improve riboflavin status (13-16). Moreover, a riboflavin nanosuspension for intramuscular long-acting injection could be a solution for malabsorption of this vitamin (17-18).
Although the symptoms of riboflavin deficiency are frequently cited, the consequences of such deficiency have not been fully researched. Further studies explaining the consequences and molecular mechanisms are necessary, especially in the field of reversibility of the deficiency symptoms. Bearing in mind the strong inflammatory base of ariboflavinosis symptoms, as described above, it appears to be particularly important to verify the effect of riboflavin deficiency on the function of immunocompetent cells. In previous publication, we have reported that macrophages are sensitive to riboflavin deficiency, which limits their viability and activity at rest, for example, impairment of phagocytosis and ability to induce respiratory burst were observed (19). Moreover, Schramm et al. (20) showed that riboflavin deficiency impairs defense mechanism against Listeria monocytogenes in mice. However, there are still a limited number of studies with regard to the effect of riboflavin deficiency on the function of leukocytes and immune responses.
Considering the above features, we have undertaken this study to determine the effect of different riboflavin concentrations (both deficiency and supplementation) on macrophages response induced by bacteria or yeast-derived factors. Moreover, the reversibility of short-term riboflavin deprivation was also assessed. We used three riboflavin concentrations for the study: 3.1 nM (corresponding to a moderate riboflavin deficiency), 10.4 nM (as a physiological state), and 300 nM (as vitamin supplementation). Special emphasis was laid on the evaluation of the impact of different riboflavin concentrations on pathogen recognition by Toll-like receptors (TLR), NFκB (nuclear factor kappa-light-chain-enhancer of activated B cells) activation, and the expression and production of crucial inflammatory mediators. Moreover, the viability of activated cells and the expression of heat shock protein 72 (Hsp72) were also assessed.
MATERIALS AND METHODS
Chemicals
DMEM medium, antibiotics: streptomycin and penicillin, fetal bovine serum (FBS), and accutase were purchased from PAA (Pasching, Austria). Riboflavin, lipopolysaccharide (LPS), zymosan, Griess reagent were purchased from Sigma-Aldrich (St. Louis, MO). Annexin V kit, Fc block antibodies, Cytofix/Cytoperm solution, PerCP-Cy5.5 streptavidin, Cytometric Bead Arrays were purchased from BD Biosciences Pharmingen (San Diego, CA, USA). Biotin anti-Hsp72 antibody StressGen was from Victoria (CA, USA). Phosphor-NFκB (Ser536) Alexa Fluor 647 Conjugate rabbit monoclonal antibody was from Cell Signaling Technology (Beverly, MA, USA). Rabbit polyclonal anti-iNOS IgG, and goat anti-rabbit-phycoerythrin were purchased from Santa Cruz Biotechnology (Santa Cruz, CA, USA). Elisa kit for HMGB1 and IL-1β were purchased from IBL International (Hamburg, Germany). RNeasy Plus Mini Kit was purchased from Qiagen (Hilden, Germany). High Capacity RNA-to-cDNA Kit, TaqMan Gene Expression Master Mix and TaqMan Gene Expression Assays were purchased from Applied Biosystems (Foster City, CA, USA).
Cell culture
Mouse monocyte/macrophage cell line RAW 264.7 was purchased from the European Type Culture Collection (ETCC; Sigma-Aldrich, St. Louis, MO, USA). The cells were cultured under standard conditions (37°C, 5% CO2) in customized (riboflavin-depleted) high-glucose DMEM medium supplemented with riboflavin to achieve the required riboflavin concentration (3.1, 10.4, and 300 nM; forming 3.1, 10.4 and 300 group, respectively). The medium was supplemented with antibiotics (100 µg/ml streptomycin and 100 U/ml penicillin) and 10% fetal bovine serum. For the experiments, cells were cultured for 5 days with lipopolysaccharide (LPS) (0.1 µg/ml; Escherichia coli, serotype 0111:B4) or zymosan stimulation (250 µg/ml) on day 5. The reversibility of riboflavin deficiency was investigated in the riboflavin-deprived group, where the medium was changed from 3.1 nM to 300 nM on day 3 or 4 (3.1 + 300D3, 3.1 + 300D4 group, respectively). Fresh cells were used for cytometric assessment of apoptosis, RNA isolation, and quantification of protein levels. Supernatants were frozen (–60°C) for future cytokine/chemokine or nitric oxide (NO) analysis.
Cell viability
Cell viability was determined using an Annexin V kit according to the protocol provided by the manufacturer. Analyses were performed on an FACScan cytometer (FACSCaliburTM; BD Biosciences) using CellQuest software (Becton Dickinson). For the analysis of data, 10,000 events were acquired.
Nitrite assay
Nitrite accumulation in the supernatant was evaluated using the Griess colorimetric method. Briefly, each 50 µl sample of the culture supernatant was mixed with an equal volume of Griess reagent (0.1% N-(1-naphthyl)-ethylenediamine, 1% sulfanilamide in 5% phosphoric acid) and incubated for 10 min at room temperature. The absorbance was measured at 540 nm (Expert Plus ASYS/Hitech spectrophotometer), and sodium nitrite was used as a standard. Each assay was performed in triplicate.
Cytometric analysis
Heat shock protein (Hsp72), NFκB, and inducible nitric oxide synthase (iNOS; NOS2) were detected by flow cytometry after labeling with a fluorescent antibody. Briefly, after a 24-hour incubation period (with or without LPS/zymosan) cells were detached by treating with accutase for 10 min at 37°C, blocked with Fc-block (0.5 mg/ml; 1:200; 20 min; 4°C), fixed, and permeabilized according to the manufacturer's instructions (Cytofix/Cytoperm). After the fixation and permeabilization process, cells were treated with an appropriate antibody. For Hsp72 detection, the biotin anti-Hsp72 antibody (0.2 mg/ml; 1:200; 20 min; 4°C) and PerCP-Cy5.5 streptavidin (0.2 mg/ml; 1:200; 20 min; 4°C) were used; for the detection of the phosphorylated form of NFκB, cells were stained with phosphor-NFkB (Ser536) Alexa Fluor 647 Conjugate rabbit monoclonal antibody (0.1 mg/ml; 1:100; 20 min); for iNOS detection, rabbit polyclonal IgG (0.2 mg/ml; 1:100; 20 min; 4°C;) and goat anti-rabbit-phycoerythrin antibodies were used (0.2 mg/ml; 1:100; 20 min; 4°C). All the antigens were detected separately. For data analysis, 10,000 events were collected on an FACScan cytometer (FACSCaliburTM; BD Biosciences) using CellQuest software (Becton Dikinson).
Cytokine/chemokine levels
For the detection of mouse tumor necrosis factor a (TNF-α), interleukin 6 (IL-6), monocyte chemoattractant protein-1 (MCP-1), keratinocyte chemoattractant (KC), and interleukin 10 (IL-10) levels in the culture supernatants, single Cytometric Bead Arrays (CBA) were used. The CBA Kits were used according to the manufacturer's instructions. Samples were acquired on an FACScan flow cytometer (FACSCaliburTM; BD Biosciences), and the analysis of the results was done by using CBA software (BD Biosciences). The levels of high-mobility group box 1 (HMGB1) and interleukin 1β (IL-1β) were determined in enzyme-linked immunosorbent spot assays (IBL International, Hamburg, Germany) according to the manufacturer's instructions and measured on a spectrophotometer (Expert Plus, ASYS/Hitech).
Analysis of gene expression by real-time PCR
Total RNA from RAW 264.7 cells was isolated using an RNeasy Plus Mini Kit. RNA was reverse transcribed using a High Capacity RNA-to-cDNA Kit. Real-time polymerase chain reaction (PCR) was performed using a StepOne Plus system (Applied Biosystems) and by applying TaqMan Gene Expression Master Mix and TaqMan Gene Expression Assays for TNF-α (Assay ID: Mm00443260_g1), IL-1β (Assay ID: Mm00434228_m1), IL-6 (Assay ID: Mn00446190_m1), MCP-1 (Assay ID: Mm00441242_m1), KC (Assay ID: Mm00433859_m1), IL-10 (Mm00439614_m1), Toll-like receptor 2 (TLR2; Assay ID: Mm01213946_g1), Toll-like receptor 6 (TLR6; Assay ID: Mm02529782_s1), Toll-like receptor 4 (TLR4; Assay ID: Mm00445273_m1), and NOS2 (Assay ID: Mm00440502_m1). PCR amplification was performed under the following conditions: denaturation at 95°C for 10 min, followed by 40 cycles at 95°C for 15 s, and then primer hybridization and extension at 60°C for 1 min. Glyceraldehyde phosphate dehydrogenase (GAPDH) was used as a reference gene (Assay ID: Mm99999915_g1). Four independent replications were performed for each riboflavin concentration. The relative transcript expression was calculated using the 2–ΔΔCt method, as described by Livak and Schmittgen (21).
Statistical analysis
Data were tested for normality of the distribution and because the data did not show a normal distribution the Mann-Whitney test was used. The level of statistical significance was set at 0.05. All data were expressed as mean ± standard deviation (X ± S.D.).
RESULTS
Cell viability
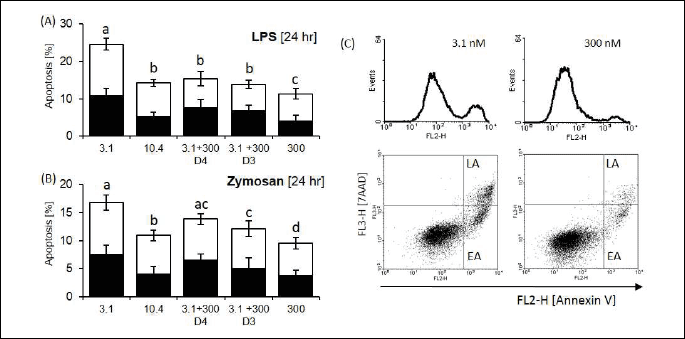
As presented in Fig. 1, cell stimulation with LPS or zymosan induced an increase in the percentage of apoptotic cells, with no effects on the number of necrotic cells. In addition, it was noted that in short-term riboflavin deficiency groups, these effects were significantly intensified in comparison to the other groups, and increases were observed in both the number of cells in the early as well as in the late stage of apoptosis. Moreover, elevation in the number of apoptotic cells observed in deprived groups was reversed after supplementation with riboflavin (300 nM) on the third or fourth day (in LPS groups) or on the third day of deprivation (in zymosan groups). It was also noted that cells cultured in medium with a high riboflavin concentration (300 nM) presented a significantly lower percentage of post-LPS apoptosis than control cells (10.4 nM). These results indicated that riboflavin-deprived cells were more susceptible to LPS- or zymosan-induced cell death; however, this effect was reversible after the timely implementation of riboflavin supplementation.
Heat shock protein 72 level
Both approaches, either LPS or zymosan administration, resulted in an enhanced production of Hsp72. Assessment of post-activation expression of Hsp72 (measured as percentage relative to the level in unstimulated cells) showed a significant reduction in Hsp72 production by riboflavin-deprived cells (Fig. 2). Short-term riboflavin deprivation, interrupted on the third day by administration of medium enriched with riboflavin (300 nM), resulted in an increase in Hsp72 expression to the level observed in the control group (10.4 nM + LPS). Moreover, in the riboflavin-supplemented group (300 nM), Hsp72 level after LPS stimulation was significantly higher compared to the control group (10.4 nM). These results indicated that riboflavin deficiency reversibly reduces the ability of macrophages to produce protective heat shock proteins and at higher concentrations may promote Hsp72 expression.

Toll-like receptors expression and nuclear factor kB phosphorylation
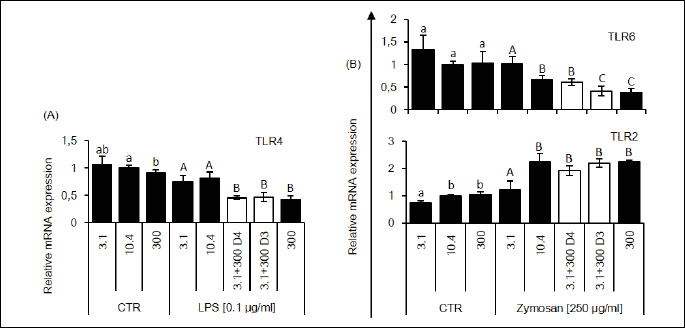
Data showed that the expression of TLRs is reduced in the case of TLR4 after LPS (Fig. 3A) and TLR6 after zymosan stimulation (Fig. 3C) and enhanced in the case of TLR2 after zymosan administration (Fig. 3B). Moreover, LPS-stimulated RAW 264.7 cells from the riboflavin-enriched group (3.1 + 300 nM D3 (day 3); 3.1 + 300 nM D4 (day 4) and 300 nM) presented significantly lower levels of TLR4 compared to the other groups (Fig. 3A). On the other hand, zymosan-stimulated riboflavin-deficient cells showed a significant reduction of TLR2 and an increase in TLR6 expression compared to the control group (10.4 nM + zymosan). Furthermore, the expression of TLR6 after zymosan stimulation was significantly reduced in the supplemented groups (3.1 + 300 nM D3 and 300 nM) compared to the control group (10.4 nM + zymosan). These findings suggest that riboflavin deficiency reversibly impairs proper TLR expression, while at higher concentrations it reduces expression of TLR4 and TLR6. This process can affect NFκB phosphorylation after zymosan stimulation in the riboflavin-supplemented cells (3.1 + 300 D3, and 300) were the level of NFκB phosphorylation were significantly reduced (Fig. 4). Moreover, as we observed, riboflavin-deprived macrophages presented excessive NFκB phosphorylation after LPS-treatment.
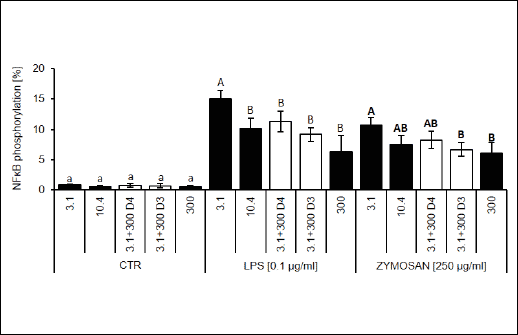 |
Fig. 4. NFκB activation after culture in a medium with various riboflavin concentration (CTR, control groups), after LPS (0.1 µg/ml) or zymosan stimulation (250 µg/ml). RAW 264.7 cells were cultured for 5 days in a medium with various riboflavin concentrations, as described in the 'Materials and methods' section. The results present the percent of cells expressing the phosphorylated form of NFκB detected by flow cytometry. Values are means with their standard deviations (n = 5 – 7). Mean values with unlike letters (a for CTR; A-B for LPS/zymosan groups) were significantly different (P < 0.05) according to the Mann-Whitney test. |
Nitric oxide production and inducible nitric oxide synthase expression
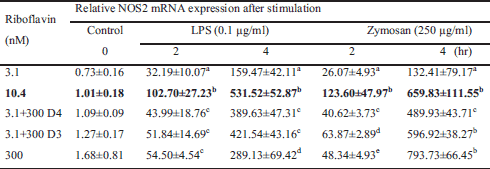
Nitric oxide (NO) production and iNOS expression in LPS- or zymosan-stimulated cells depend on the concentration of riboflavin (Table 1, Fig. 5). Compared to the group maintained at the 'physiological' riboflavin concentration (10.4 nM), the riboflavin-deficient cells (3.1 nM) produced significantly less NO, which was reflected in a significant reduction in either iNOS gene expression (Table 1) or iNOS protein production (Fig. 5A). The type of stimulating factor (LPS or zymosan) had an impact on iNOS expression and NO production in cells cultured in medium supplemented with riboflavin (300 nM). LPS stimulation resulted in higher NO production (the same effect was observed in 3.1 + 300 nM D3 group), while the production of NO was diminished in zymosan-stimulated groups, which was the effect of a reduction in either iNOS gene expression (Table 1) or iNOS protein production (Fig. 5A).
The relative mRNA expression of NOS2 was measured after 0, 2 or 4 h incubation with LPS or zymosan. Values are the mean ± S.D. Mean values with unlike letters (a-e) were significantly different (P < 0.05) according to the Mann-Whitney test.
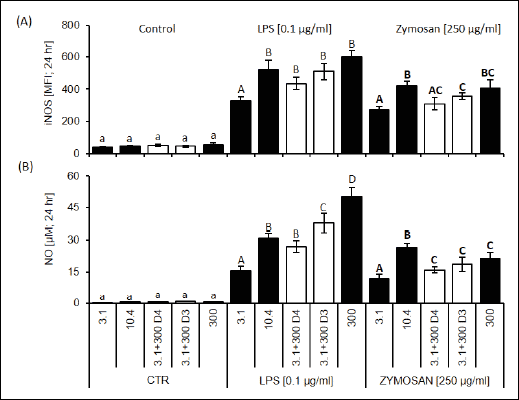 |
Fig. 5. Inducible nitric oxide synthase (iNOS/NOS2) expression and nitric oxide (NO) production after LPS (0.1 µg/ml) or zymosan stimulation (250 µg/ml). The figure presents (A) the level of iNOS protein expression measured by flow cytometry and expressed as a mean fluorescence intensity (MFI) at 24 hours of culture (control) and LPS or zymosan activation; (B) and nitric oxide (NO) production after 24-hour of culture (control) or stimulation with LPS or with zymosan. Values are means with their standard deviations (n = 5 – 7). Mean values with unlike letters (a for CTR; A-C for LPS/zymosan groups) were significantly different (P < 0.05) according to the Mann-Whitney test. |
Cytokine/chemokine expression and release
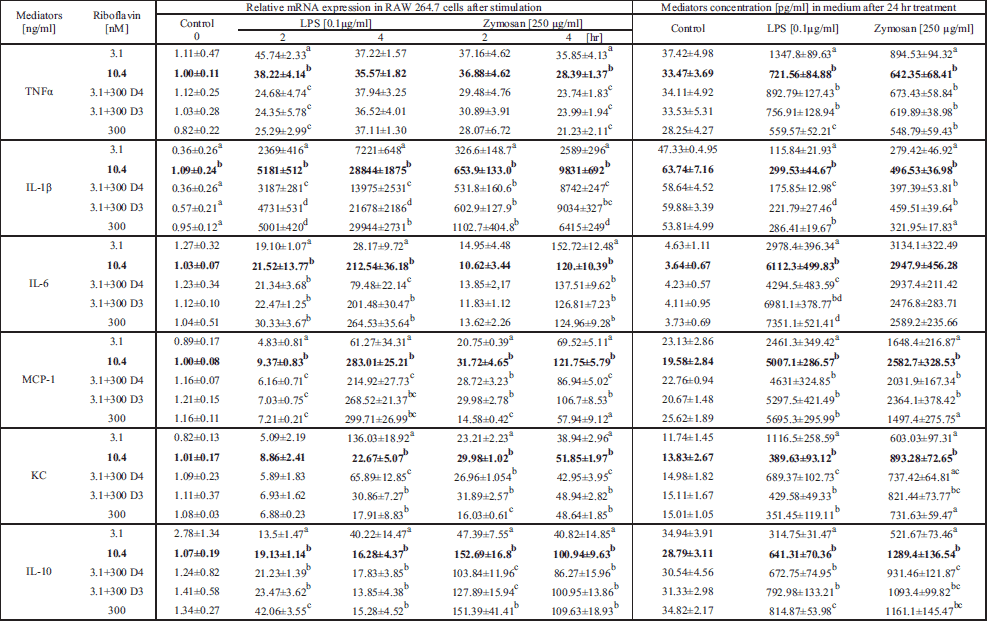
Riboflavin deficiency affected cytokine/chemokine production, as well in LPS- as in zymosan-stimulated cells (Table 2 and Fig. 6). In the LPS-stimulation model, riboflavin-deprived cells released significantly less proinflammatory IL-1β, MCP-1, IL-6, and anti-inflammatory IL-10 (Table 2) compared with control cells (10.4 nM + LPS). However, the levels of proinflammatory TNF-α, KC (Table 2), and HMGB1 (Fig. 6) were significantly elevated. Moreover, riboflavin-enriched cells (300 nM) produced significantly less proinflammatory TNF-α and late IL-6, but significantly more anti-inflammatory IL-10. In the zymosan-stimulation model, riboflavin-deprived cells released significantly less proinflammatory IL-1β, MCP-1, KC, and anti-inflammatory IL-10 (Table 2), while the levels of proinflammatory HMGB1 (Fig. 6) and TNF-α (Table 2) were elevated. Moreover, riboflavin-enriched cells (300 nM) produced significantly less proinflammatory IL-1β, MCP-1, and KC (Table 2). The results described above correspond to the levels of gene expression (Table 2). In both models, the effects of short-term riboflavin deficiency were negated by riboflavin enrichment to a concentration of 300 nM on day 3 or 4 (LPS model) or on day 3 (zymosan model). Riboflavin deprivation reversibly impairs cytokine/chemokine production leading to increased release of some pro-inflammatory factors. However, riboflavin enrichment results in a reduction of the release of proinflammatory factors and an enhancement of anti-inflammatory mediators.
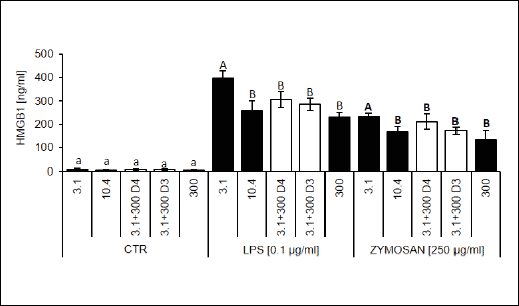 |
Fig. 6. High-mobility group box 1 (HMGB1) production by RAW 264.7 cells measured in supernatant at 24 hours of culture in control (CTR) medium, after LPS (0.1 µg/ml) or zymosan stimulation (250 µg/ml). RAW 264.7 cells were cultured for 5 days in a medium with various riboflavin concentrations, as described in the 'Materials and methods' section. Values are means with their standard deviations (n = 5 – 7). Mean values with unlike letters (a for CTR; A-B for LPS/zymosan groups) were significantly different (P < 0.05) according to the Mann-Whitney test. |
The relative mRNA expression of various mediators was measured after 0, 2 or 4 h incubation with LPS or zymosan, the level of released mediators was measured after 24 h of culture. Values are the mean ± S.D. Mean values with unlike letters (a-d) were significantly different (P < 0.05) according to the Mann-Whitney test.
DISCUSSION
In recent years, numerous studies highlighted the anti-inflammatory effects of high, pharmacological doses of riboflavin. Beneficial effect of this vitamin was disclosed in the field of both improvement of animal survival in septic shock and reduction in proinflammatory cytokines release (22-25). However, little research has focused on the impact of lower riboflavin concentration, which can be observed in the state of its deficiency or enrichment by taking vitamin pills. This work shows that even small changes in the riboflavin concentration have an impact on the functioning of immune system through its action on the key immunocompetent cells, that is, the macrophages.
Our current and previous study (19) demonstrates that RAW 264.7 macrophages are sensitive to changes in riboflavin concentration and present signs of its deficiency within only 5 days. As we presented previously (19), a culture of RAW 264.7 cells in a marginally low riboflavin concentration (3.1 nM) led to impaired proliferation of quiescent cells and increased cell death by apoptosis. Moreover, riboflavin deprivation affects macrophage ability to adhere and impairs cell response by a reduction of phagocytosis and respiratory burst (19). In the current study, we focused on assessing the impact of riboflavin on macrophage activation by bacterial or yeast agent. This study reports three important aspects that are exerted by riboflavin deficiency and supplementation on activated macrophages. First, a reduction in the riboflavin concentration impairs the ability of macrophages to pathogen recognition via a reduction in TLR2 expression and TLR4 production (data not shown). This process impairs the response of macrophages by decreasing the iNOS expression and releasing lower amount of inflammatory factors, such as NO, IL-1β, MCP-1, IL-6, and IL-10. This suggests that the riboflavin deficiency impairs the first line of immune defense. Moreover, a culture of macrophages in a marginally low riboflavin concentration results in pathologic activation, leading to excessive release of strong proinflammatory cytokines such as HMGB1 and TNF-α, enhancement of cell death by apoptosis, a weakening of the expression of the protective protein Hsp72, and, in the case of LPS stimulation, also increased NFκB activation. Second, the negative consequences of riboflavin deficiency are eliminated by enriching the medium with riboflavin (up to 300 nM) on the third (zymosan-stimulated group) or third/fourth day of deprivation (LPS-stimulated cells). Third, a short-term cell culture in riboflavin-enriched medium (300 nM) had a protective effect on LPS-stimulated macrophages, which was reflected in a reduction of cell death by apoptosis and by enhanced expression of the chaperone protein Hsp72 in both LPS and zymosan models. In addition, weak anti-inflammatory effects were observed upon cell cultures in riboflavin-supplemented environments. In the zymosan model, macrophages expressed significantly less TLR6 and iNOS (and consequently produced less NO); moreover, as a result of decreased gene expression, cells released significantly less crucial inflammatory factors such as IL-1β, MCP-1, or KC. In the case of LPS-stimulated macrophages, riboflavin enrichment resulted in a reduction of proinflammatory TNF-α and an elevation of late IL-6 and NO, as well as anti-inflammatory IL-10.
Due to the expression of TLRs, immunocompetent cells, including macrophages, have the ability to recognize pathogen-associated molecular patterns (PAMPs) exhibited by various groups of organisms such as bacteria, viruses, mycobacteria, parasites, and fungi (26). TLR4 is the principal receptor for the recognition of bacterial LPS, which interacts with the CD14 and MD2 coreceptors, while zymosan recognition depends on heterodimers of TLR6 and TLR2. The downstream signaling pathway of TLR4 and TLR6-TLR2 is mediated by several protein complexes and leads to the phosphorylation and translocation of NFkB to the nucleus, where as a transcription factor it activates gene expression and mediates the production of inflammatory mediators such as the cytokines/chemokines (TNF-α, IL-6, MCP-1) and NO (26, 27). In this study, riboflavin deprivation diminished TLR4 and TLR2 protein production with no effect on CD14 or TLR6 (data not shown). Study of gene expression indicated significantly lower TLR2, but no TLR4 expression (Fig. 3A and 3B). This result may suggest that the reduction of TLR2 production was due to lower gene expression, while the diminished TLR4 level was the result of disruption in posttranscriptional processing. The aspect of impaired maturation of proteins in the state of riboflavin deficiency was previously shown by Manthey et al. (28). However, in both the cases, zymosan and LPS recognition is impaired. Contrary to our expectations, a reduction in TLRs did not decrease the NFκB phosphorylation, which was elevated in the LPS-treated riboflavin-deficiency group (Fig. 4). However, it should be borne in mind that unlike the cytokines, the secretion of which depends on new protein synthesis, NFκB is stored in the cell cytoplasm and subsequent protein synthesis is not needed for its activation. In addition, NFκB activation may be accomplished by a number of factors, such as endotoxins TNF-α, IL-1β, mitogens, viral, protein, or chemical agents (29). Therefore, it can be assumed that the increase in NFκB phosphorylation is not a result of direct response to stimulation by LPS via TLR4, but probably is a result of indirect activation by factors not included in this study. Moreover, this study demonstrated that LPS or zymosan activation was accompanied by an increase in release of HMGB1, which was reversed by riboflavin enrichment. HMGB1 is a ubiquitous nuclear DNA-binding protein that can be secreted actively by both stimulated monocytes and macrophages, and passively by necrotic or damaged cells (30). As a late mediator of inflammation, HMGB1 acts as a pro-inflammatory cytokine that amplifies the inflammatory response (31), and is important in the pathogenesis of sepsis (32), lung inflammation (33), and arthritis (34). HMGB1, through interaction with a RAGE receptor (the receptor for advanced proteolytic glycation end products) (35), leads to LPS-independent NFκB activation (36) and elevation of certain proinflammatory cytokines such as TNF-α. Moreover, as presented by Andersson et al. (37), TNF-α release occurs in two peaks at 3 and 8 – 10 hours, with elevated mRNA expression 8 – 10 hours after HMGB1 stimulation. Given that LPS induced excessive HMGB1 release about 8 hours after stimulation (31) and that enhanced apoptosis promote HMGB1 release (38), the significantly higher NFκB phosphorylation and elevated level of TNF-α secreted in our study by riboflavin-deprived macrophages (Table 2) may be because of secondary activation by HMGB1, both released by apoptotic cells and actively upon LPS stimulation. Moreover, in normal conditions, NFκB activation and excess TNF-α production is inhibited by IL-10 (39), the secretion of which is impaired in a riboflavin-deficient state. Enhancement of TNF-α secretion is one of the mechanisms by which LPS induces apoptosis in macrophages (40); the level of TNF-α correlated positively with the percentage of apoptotic cells in our study, which, as reported by Qin et al. (38), can induce the release of HMGB1. Furthermore, it should be noted here, that the prolonged cellular stress (as e.g. starvation) can leads to translocation of HMGB1 to the cytosol, and consequently to the autophagy induction by participation in Beclin-1-Bcl2 complex dissociation (41). The autophagy process was not study in this paper. However, a decreased abundance of TLR4 or TLR2 receptors impairs the ability of macrophages to recognize PAMPs and leads to diminish the acute phase of the antibacterial or antifungal immune response. This argument is justified by analysis of the other inflammatory factors released by stimulated macrophages upon the state of riboflavin deficiency. Riboflavin-deficient RAW 264.7 cells presented lower iNOS expression and NO production in response to either LPS or zymosan stimulation (Fig. 5). This effect was effectively eliminated on the third or fourth day of riboflavin deficiency by riboflavin administration in a concentration corresponding to vitamin pill supplementation. NO is an omnipresent intracellular messenger in all vertebrates. Under physiological conditions, NO is synthesized continuously through nNOS and eNOS; however, at low levels. NO modulates the blood flow, thrombosis, neural activity, skeletal muscle contractile force and development, total body Na+ content, and body fluid homeostasis (42-43) as well as development of endotoxin tolerance (44). However, the concentration of NO can rapidly increase through enhanced iNOS expression under certain circumstances (e.g., inflammation). This temporary NO excess is crucial for proper host defense, as NO acts as an antibacterial, antiparasitic, and antiviral agent (42). Bearing in mind the immunomodulatory effect of riboflavin seems to be appropriate to undertaken the study on the impact of riboflavin status on development of endotoxin tolerance.
With regards to the beneficial effects of NO in innate immune systems, the results of our study indicate impaired macrophage effectors function through lowered NO output in stimulated riboflavin-deficient cells. Such decreased NO production might be a result of the inhibited activity of iNOS through a shortage of flavin. iNOS is a homodimeric flavoprotein in which each monomer consists of two domains: an N-terminal oxygenase and a C-terminal reductase domain that has bound FAD and FMN as cofactors. This reductase domain with FAD and FMN provides the electron transport necessary to drive the reaction of NO production which then occurs in the oxygenase domain (45). Riboflavin is a precursor of FAD and FMN (4), so the state of riboflavin deficiency reduces the intracellular level of both the cofactors. However, it is more probable that the impaired NO production affects iNOS expression. LPS-induced iNOS expression runs via a complex of intracellular signaling cascades, including adaptors such as IRAK and MyD88, which activate downstream molecules, including TRAF6. This pathway activates signaling pathways including the mitogen-activated protein kinase (MAPK) pathway and the NFκB pathway, which activate iNOS transcription (46). Furthermore, iNOS promoters exhibit binding sites for numerous transcriptional factors (such as Ap-1, IRF-1, NFκB, NF-IL6, STAT-1α) (47). This is the reason why the induction or inhibition of iNOS expression may occur through a wide variety of signal transduction pathways. For example, it has been shown that erstressin, a molecule activator of the unfolded protein response (UPR), leads to the downregulation of cytokine-induced iNOS expression (48). Consistent with our findings, the affected NO production seems to be a result of inappropriate iNOS expression and UPR, and this in turn results from improper TLR4 or TLR2 expression. These findings could, moreover, explain the lowered levels of IL-6, MCP-1, and IL-10 observed in our study in the riboflavin-deficient group. Cytokine expression is regulated on a variety of levels, from transcription to protein folding and maturity. Proper folding of proteins depends on the appropriate level of flavoproteins present on HepG2 cells cultured in a riboflavin-depleted medium. Short-term riboflavin deprivation induced the UPR (28, 49). On the other hand, it should be noted that the response of macrophages cultured in an enhanced riboflavin environment suggests that vitamin B2, even at such low concentrations as those we observed in the use of vitamin pills, may exert a weak anti-inflammatory effect. This effect is not as strong as in the case of pharmacological doses of riboflavin, however, vitamin B2 can provide support for the proper functioning of macrophages in the site of inflammation. These data are consistent with the results reported previously by others, which presented beneficial effects of high dose of riboflavin in reduction of inflammation (22-25), or cancer progression after treatment with irradiated riboflavin (50), as well as can partly justify an anti-inflammatory effect of plant extracts with a significant share of flavonoids (51, 52).
In conclusion, our study provides evidence that riboflavin is essential for the proper functioning of macrophages, and its appropriate concentration determines the correct course of macrophage activation in response to the pathogen. Riboflavin deprivation disrupts macrophage activation, leading to a decrease in the capacity for pathogen recognition and the generation of an appropriate immune response. Moreover, the deprivation state induced a pathologic, excessive proinflammatory response resulting in the intensification of apoptosis and the release of damage factors (TNF-α, HMGB1). The negative consequences of short-term riboflavin deprivation are reversible if enrichment occurs sufficiently quickly. Moreover, riboflavin supplementation to the level observed after vitamin pill intake improves the viability of macrophages and exerts a weak anti-inflammatory effect.
Acknowledgments: This study was supported by the research project from NCN No. UMO-2011/01/D/NZ6/02704. The authors thank Andrzej Doniec (MSc) from Department of Genetics and Evolution, Institute of Zoology, Jagiellonian University, for providing excellent technical assistance in conducting real-time PCR.
Conflict of interest: None declared.
REFERENCES
- Wintergerst ES, Maggini S, Horning DH. Contribution of selected vitamins and trace elements to immune function. Ann Nutr Metab 2007; 51: 301-323.
- Powers HJ, Hill MH, Mushtaq S, Dainty JR, Majsak-Newman G, Williams EA. Correcting a marginal riboflavin deficiency improves hematologic status in young women in the United Kingdom (RIBOFEM). Am J Clin Nutr 2011; 93: 1274-1284.
- Subramanian VS, Subramanya SB, Ghosal A, Said HM. Chronic alcohol feeding inhibits physiological and molecular parameters of intestinal and renal riboflavin transport. Am J Physiol Cell Physiol 2013; 305: C539-C546.
- Powers HJ. Riboflavin (vitamin B-2) and health. Am J Clin Nutr 2013; 77: 1352-1360.
- Wacker J, Fruhauf J, Schulz M, Chiwora F, Volz J, Becker K. Riboflavin deficiency and preeclampsia. Obstet Gynecol 2000; 96: 38-44.
- Jen M, Yan AC. Syndromes associated with nutritional deficiency and excess. Clin Dermatol 2010; 28: 669-685.
- Brown KL, Philips TJ. Nutrition and wound healing. Clin Dermatol 2010; 28: 432-439.
- Wada Y, Kondo H, Itakura C. Peripheral neuropathy of dietary riboflavin deficiency in racing pigeons. J Vet Med Sci 1996; 58: 161-163.
- Pangrekar J, Krishnaswamy K, Jagadeesan V. Effects of riboflavin deficiency and riboflavin administration on carcinogen-DNA binding. Food Chem Toxicol 1993; 31: 745-750.
- Siassi F, Ghadirian P. Riboflavin deficiency and esophageal cancer: a case control-household study in the Caspian Littoral of Iran. Cancer Detect Prev 2005; 29: 464-469.
- Nakano E, Mushtaq S, Heath PR, et al. Riboflavin depletion impairs cell proliferation in adult human duodenum: Identification of potential effectors. Dig Dis Sci 2011; 56: 1007-1019.
- Lee ES, Corfe BM, Powers HJ. Riboflavin depletion of intestinal cells in vitro leads to impaired energy generation and enhanced oxidative stress. Eur J Nutr 2013; 52: 1513-1521.
- LeBlanc JG, Laino JE, del Valle MJ, et al. B-Group vitamin production by lactic acid bacteria-current knowledge and potential applications. J Appl Microbiol 2011; 111: 1297-1309.
- Capozzi V, Russo P, Duenas MT, Lopez P, Spano G. Lactic acid bacteria producing B-group vitamins: a great potential for functional cereals products. Appl Microbiol Biotechnol 2012; 96: 1383-1394.
- Arena MP, Fiocco D, Massa S, et al. Lactobacillus plantarum as a strategy for an in situ production of vitamin B2. J Food Nutr Disor 2014; S1: 004. doi: 10.4172/2324-9323.S1-004.
- Russo P, Capozzi V, Arena MP, et al. Riboflavin-overproducing strains of Lactobacillus fermentum for riboflavin-enriched bread. Appl Microbiol Biotechnol 2014; 98: 3691-3700.
- Du L, Li G, Jin Y, Wang L, Xu Q, Dong J. Riboflavin laurate nanosuspensions as an intramuscular injection for long-term riboflavin supplementation. Int J Pharm 2013; 450: 338-344.
- Hu X, Lin X, Gu Y, et al. Biocompatible riboflavin laurate long-acting injectable nanosuspensions allowing sterile filtration. Drug Deliv 2014; 21: 351-361.
- Mazur-Bialy AI, Buchala B, Plytycz B. Riboflavin deprivation decrease macrophage viability and activity - study on RAW 264.7 cell line. Br J Nutr 2013; 110: 509-514.
- Schramm M, Wiegmann K, Schramm S, et al. Riboflavin (vitamin B2) deficiency impairs NADPH oxidase 2 (Nox2) priming and defense against Listeria monocytogenes. Eur J Immunol 2014; 44: 728-741.
- Livak KJ, Schmittgen TD. Analysis of relative gene expression data using real-time quantitative PCR and the 2(-delta delta C(T)) method. Methods 2001; 25: 402-408.
- Mazur-Bialy AI, Majka A, Wojtas L, Kolaczkowska E, Plytycz B. Strain-specific effects of riboflavin supplementation on zymosan-induced peritonitis in C57BL/6J, BALB/c and CBA mice. Life Sci 2011; 88: 265-271.
- Mazur-Bialy AI, Pochec E. HMGB1 inhibition during zymosan-induced inflammation: the potential therapeutic action of riboflavin. Arch Immunol Ther Exp (Warsz) 2015 Oct 7, doi: 10.1007/s00005-015-0366-6 (epub ahead of print).
- Mal P, Dutta K, Bandyopadhyay D, Basu A, Khan R, Bishayi B. Azithromycin in combination with riboflavin decreases the severity of Staphylococcus aureus infection induced septic arthritis by modulating the production of free radicals and endogenous cytokines. Inflamm Res 2013; 62: 259-273.
- Shih CK, Chen CM, Chen CY, et al. Riboflavin protects mice against liposaccharide-induced shock through expression of heat shock protein 25. Food Chem Toxicol 2010; 48: 1913-1918.
- Kawai T, Akira S. Toll-like receptors and their crosstalk with other innate receptors in infection and immunity. Immunity 2011; 34: 637-650.
- Kawai T, Akira S. Signaling to NF-kappaB by Toll-like receptors. Trends Mol Med 2007; 13: 460-469.
- Manthey KC, Chew YC, Zempleni J. Riboflavin deficiency impairs oxidative folding and secretion of apolipoprotein B-100 in HepG2 cells, triggering stress response systems. J Nutr 2005; 135: 978-982.
- Blackwell TS, Christman JW. The role of nuclear factor-kB in cytokine gene regulation. Am J Respir Cell Mol Biol 1997; 17: 3-9.
- Scaffidi P, Misteli M, Bianchi ME. Release of chromatin protein HMGB1 by necrotic cells triggers inflammation. Nature 2002; 418: 191-195.
- El Gazzar M. HMGB1 modulates inflammatory responses in LPS-activated macrophages. Inflamm Res 2007; 56: 162-167.
- Andersson U, Tracey KJ. HMGB1 in sepsis. Scand J Infect Dis 2003; 35: 577-584.
- Abraham E, Arcaroli J, Carmody A, Wang H, Tracey KJ. HMG-1 as a mediator of acute lung injury. J Immunol 2000; 165: 2950-2954.
- Andersson U, Erlandsson-Harris U. HMGB1 is a potent trigger of arthritis. J Intern Med 2004; 255: 344-350.
- Hori O, Brett J, Slattery T, et al. The receptor for advanced glycation end products (RAGE) is a cellular binding site for amphoterin. Mediation of neurite outgrowth and co-expression of rage and amphoterin in the developing nervous system. J Biol Chem 1995; 270: 25752-25761.
- Huttunen HJ, Fages C, Rauvala H. Receptor for advanced glycation end products (RAGE)-mediated neurite outgrowth and activation of NF-kappaB require the cytoplasmic domain for the receptor but different downstream signaling pathways. J Biol Chem 1999; 274: 19919-19924.
- Andersson U, Erlandsson-Harris H, Yang H, Tracey KJ. HMGB1 as a DNA-binding cytokine. J Leukoc Biol 2002; 72: 1084-1091.
- Qin S, Wang H, Yuan R, et al. Role of HMGB1 in apoptosis-mediated sepsis lethality. J Exp Med 2006; 203: 1637-1642.
- Schottelius AJ, Mayo MW, Sartor RB, Baldwin AS. Interleukin-10 signaling blocks inhibitor of kappaB kinase activity and nuclear factor kappaB DNA binding. J Biol Chem 1999; 274: 31868-31874.
- Xaus J, Comalada M, Valledor AF, et al. LPS induces apoptosis in macrophages mostly through the autocrine production of TNF-α. Blood 2000; 95: 3823-3831.
- Toton E, Lisiak N, Sawicka P, Rybczynska M. Beclin-1 and its role as a target for anticancer therapy. J Physiol Pharmacol 2014; 65: 459-467.
- Colasanti M, Suzuki H. The dual personality of NO. Trends Pharmacol Sci 2000; 21: 249-252.
- Pacher P, Beckman JS, Liaudet L. Nitric oxide and peroxynitrite in health and disease. Physiol Rev 2007; 87: 315-424.
- Soszynski D, Daniluk M, Galazka M, Dimitruk K. Blokade of nitric oxide formation in the rat brain does not disturb development of endotoxin tolerance. J Physiol Pharmacol 2013; 64: 779-788.
- Daff S. NO synthase: structures and mechanisms. Nitric Oxide 2010; 23: 1-11.
- Lowenstein CJ, Padalko E. iNOS (NOS2) at a glance. J Cell Sci 2004; 117: 2865-2867.
- Kleinert H, Pautz A, Linker K, Schwarz PM. Regulation of the expression of inducible nitric oxide synthase. Eur J Pharmacol 2004; 500: 255-266.
- Symons KT, Massari ME, Dozier SJ, et al. Inhibition of inducible nitric oxide synthase expression by a novel small molecule activator of the unfolded protein response. Curr Chem Genomics 2008; 2: 1-9.
- Werner R, Manthey KC, Griffin JB, Zempleni J. HepG2 cells develop signs of riboflavin deficiency within 4 days of culture in riboflavin-deficient medium. J Nutr Biochem 2005; 16: 617-624.
- Chaves Neto AH, Pelizzaro-Rocha KJ, Fernandes MN, Ferreira-Halder CV. Antitumor activity of irradiated riboflavin on human renal carcinoma cell line 786-O. Tumor Biol 2014; 36: 595-604.
- Parvu AE, Parvu M, Vlase L, Miclea P, Mot AC, Silaghi-Dumitrescu R. Anti-inflammatory effects of Allium schoenoprasum L. leaves. J Physiol Pharmacol 2014; 65: 309-315.
- Burkhari AI. The central analgesis and anti-inflammatory activities of the methanolic extract of Carthamus oxycantha. J Physiol Pharmacol 2013; 64: 369-375.
A c c e p t e d : December 4, 2015