COMPARISON OF ACETAMINOPHEN TOXICITY IN PRIMARY HEPATOCYTES ISOLATED FROM TRANSGENIC MICE WITH DIFFERENT
APOLIPOPROTEIN E ALLELES
2Department of Medical Biochemistry, Faculty of Medicine in Hradec Kralove, Charles University in Prague, Hradec Kralove, Czech Republic
INTRODUCTION
Acetaminophen (APAP), also known as paracetamol, is a widely used analgesic and antipyretic. APAP is safe when administered in modest doses; however, high doses can lead to liver injury or even liver failure (1-3). Apart from damage to hepatocytes, also the involvement of nonparenchymal liver cells contributes to the injury (4). Patients abusing alcohol are at high risk of developing liver failure (1, 5). Similarly, non-alcoholic fatty liver disease (NAFLD) seems to predispose liver to the toxicity of APAP and other toxicants (6-9).
Early administration of N-acetylcysteine remains the main therapeutic option for APAP overdose (1). In experimental studies, several other strategies were suggested to ameliorate the APAP-induced liver injury: inhibition of 5-lipoxygenase (10), inhibition of protein tyrosine phosphatase 1B (11), activation of autophagy (12), inhibition of c-Jun N-terminal kinase (13), free radical scavenging (14) and activation of Nrf2 (15).
The nuclear factor erythroid 2-related factor 2 (Nrf2) is a transcription factor important for combating electrophilic and oxidative stress in the liver and other organs (16, 17). This encompasses the detoxification of hepatotoxic drugs such as acetaminophen (APAP). Mice with Nrf2 gene knockout were more susceptible (18, 19) and mice with Nrf2 activation were more resistant to the toxicity of APAP (15, 20-22). Nrf2 can be activated by many phytochemicals as well as synthetic substances (16, 21, 23).
Recently, an association between the apolipoprotein E (ApoE) genotype and Nrf2 expression was described (24). The authors found lower nuclear Nrf2 levels as well as lower expression of Nrf2-dependent genes in transgenic mice carrying the human ApoE4 allele when compared to mice carrying the human ApoE3 allele. This could be due to a more proinflammatory state in the ApoE4 versus ApoE3 genotype (24), at least partly attributable to a high production of 5-oxo-eicosatetraenoic acid in ApoE4 carriers (25).
Formerly, the ApoE-knockout mice were used as a model of atherosclerosis (26). In transgenic mice carrying human alleles, the ApoE4 allele was recognized as posing a greater cardiovascular risk compared to the ApoE3 allele (27).
The ApoE4 genotype constituted a higher risk of severe disease in patients with primary biliary cirrhosis (28) but was protective against NAFLD when compared to the ApoE3 genotype (29, 30). In a proteomic study, Merrick et al. described downregulation of serum apolipoprotein E levels after APAP exposure in rats (31). To the best of our knowledge, the relation between the ApoE genotype and APAP hepatocyte toxicity has not yet been investigated.
In the present study, we compared the toxicity of APAP on primary culture hepatocytes isolated from transgenic mice carrying different human ApoE alleles (ApoE3 or ApoE4) and from wild-type mice.
MATERIAL AND METHODS
Chemicals
Collagenase (lot 120296, 0.12 PZU/mg) was purchased from Seva (Heidelberg, Germany). The anesthetic ketamine (Narketan) was obtained from Vetoquinol (Lure Cedex, France) and the xylazine (Rometar) from Bioveta (Ivanovice na Hane, Czech Republic). Reagents and kits are described in the respective paragraphs. All other chemicals were in analytical grade and purchased from Sigma-Aldrich (St. Louis, MO, USA).
Animals
Female mice with targeted replacement of the endogenous mouse ApoE gene with human ApoE3 or ApoE4 gene on a C57Bl/6 background (age 7 – 9 weeks, body weight 20.2 ± 1.3 g) were purchased from Taconic (Hudson, NY, USA). Female C57Bl/6 age-matched mice, obtained from Velaz (Unetice, Czech Republic), were used as wild-type (WT) controls. The mice were housed at 23 ± 1°C, 55 ± 10% humidity, with air exchange 12 – 14 times/h and a 12h light-dark cycle. All animals had free access to tap water and were fed a standard ST-1 pelleted diet ad libitum (Velas, Lysa nad Labem, Czech Republic). All animal care was in accordance with Czech legislation. Our study was approved by the Animal Welfare Body of the Faculty of Medicine in Hradec Kralove and by the Czech Ministry of the Environment.
Hepatocyte preparation
Before the isolation, the mice were pre-anesthetized with ether and then injected intraperitoneally with a mixture of ketamine (100 µg/g body weight) and xylazine (10 µg/g body weight) dissolved in water for injections. Hepatocytes were isolated by two-step collagenase perfusion as described by Bajt et al. (32) with some modifications. Before opening the abdominal cavity, heparin was injected intraperitoneally (0.5 IU/g body weight) to prevent blood clotting throughout the subsequent steps. After opening the abdominal cavity, the falciform ligament was deranged and the gallbladder excised. The portal vein was then cannulated with a 20G needle and the liver perfused in situ, first with a calcium-free solution for 3 minutes, then with a solution containing collagenase (1 mg/ml). When the liver took up a sponge-like appearance (8 – 10 minutes), it was excised and mechanically separated into a suspension of hepatocytes. The suspension was purified by filtration through sterile gauze and underwent repeated centrifugation in a cold centrifuge at 28 g.
Cell viability was determined by a Trypan blue exclusion test (in all isolations > 80%). Cell density was counted using a Cellometer (Nexcelom Bioscience, Lawrence, MA, USA). Afterwards, the suspension was diluted in Williams E medium enriched with 6% fetal bovine serum (Merck Millipore, Berlin, Germany), glutamine (2 mmol/l), penicillin (100 IU/ml), streptomycin (10 mg/ml), insulin (0.08 IU/ml), dexamethasone (0.12 µg/ml) and glucagon (0.008 µg/ml) to a density of 4 × 10⁵ cells/ml. After seeding on collagen-coated cultivating 6-well (2 ml per well; for qRT-PCR), 12-well (1 ml per well; for phase contrast imaging and protein isolation), 24-well (0.3 ml; for LDH leakage, glutathione levels and Oil Red O staining) and 96-well (0.1 ml; for WST-1 test, reactive oxygen species measurements and caspase activities) NUNC plates (Thermo Scientific, Waltham, MA, USA) for 2 hours, the medium was removed and the serum-free Williams E medium with concentrations of APAP ranging from 0.5 mmol/l to 4 mmol/l was added. The cells were incubated at 37°C in an atmosphere with 5% CO2 for up to 24 hours.
RNA isolation and quantitative real-time PCR
The total RNA from hepatocyte suspensions (leftover not used for seeding) and from the 6-well plates treated for 24 hours was isolated by phenol-chloroform extraction using RNA Blue (Top-Bio, Prague, Czech Republic). Afterwards, the total RNA of each sample was reverse transcribed using oligo-dT primers (Generi Biotech, Hradec Kralove, Czech Republic) and M-MLV Reverse Transcriptase (Top-Bio) according to manufacturers’ instructions. Genes of interest were Nrf2-dependent genes (24) glutathione S-transferase 2 (Gsta2), heme oxygenase-1 (Hmox1) and NAD(P)H dehydrogenase, quinone 1 (Nqo1). A primer design summary is provided in Table 1. To avoid genomic DNA contamination, the primers were designed to span exon boundaries. The hydrolyzation probes were labeled with FAM fluorescent reporter dye. The selection of the two housekeeping genes was based on experimental validation of their expression stability: beta 2-microglobulin (β2m) and polypeptide A RNA-Polymerase II (Polr2a). Real-time quantitative RT-PCR was performed on a CFX96 Touch cycler (Bio-Rad Laboratories, Hercules, CA, USA) with amplification conditions: 95°C for 3 min, and 50 cycles of 95°C for 10 s and 60°C for 20 s. Each cDNA sample was analyzed in PCR triplicates.
REST 2009 software V2.0.13 (QIAGEN GmbH, Hilden, Germany) was applied to determine statistically significant expression differences and relative fold changes (33).
Microscopic evaluation
All images were taken using an Olympus IX51 microscope with an E-600 Digital Camera (Olympus Imaging Corp., Tokyo, Japan) and Quick Photo Camera 3.0 software (Promicra, Prague, Czech Republic). Scale bars were added using the Quick Photo Camera software; no other image editing was performed. The objective magnifications used was × 40. All the types of staining described below were performed at room temperature.
Phase contrast images were taken at 4 h and 24 h after isolation.
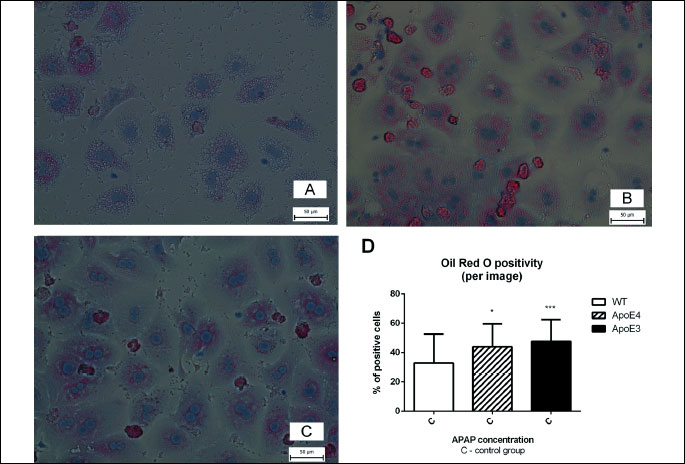
To semi-quantify the presence of lipids, we used a Steatosis Colorimetric Assay Kit (Cayman Chemical Comp., Ann Arbor, MI, USA) based on Oil Red O dye; haematoxylin was used for nuclear counter-staining. We checked for Oil Red O positive cells, i.e. cells with orange-red cytoplasm in the bright field mode. The positive cells were then counted in at least 10 visual fields; at least 500 cells were included. The percentage of positivity was then calculated.
The mitochondrial membrane potential was evaluated using JC-1 Dye (Life Technologies, Carlsbad, CA, USA) as described previously (34). Briefly, the cells were incubated for 45 minutes at 37°C with 10 µM JC-1 dye dissolved in the medium. After washing, the cells were visualized in fluorescence mode. The percentage of cells with high mitochondrial membrane potential was counted; at least 230 cells per group were included.
Viability tests: WST-1, lactate dehydrogenase activity and leakage
The activity of intracellular dehydrogenases was determined using Cell Proliferation Reagent WST-1 (Roche, Penzberg, Germany) as described previously (35). The medium was removed and the WST-1 reagent diluted 1:10 in Williams E medium was added to the cells. Absorbance at 450 nm was measured at time 0 and at 60 minutes using a TECAN Infinite M200 spectrophotometer (Tecan Group AG, Mannedorf, Switzerland). The difference between these values was calculated and used for statistical evaluation.
Lactate dehydrogenase (LDH) activity was measured in the media and in the cell lysate using a commercial kit from DiaSys (Holzheim, Germany). In order to lyse the cells, we collected the media, added Cell Lysis Buffer (Cell Signaling Technology, Danvers, MA, USA) and scraped the cells. The LDH leakage was calculated as a ratio of extracellular and total LDH activity.
Markers of oxidative stress: dichlorodihydrofluorescein diacetate (DCFDA) and malondialdehyde (MDA)
The production of reactive oxygen species (ROS) was determined using fluorescence probe DCFDA obtained from Life Technologies, as described previously (34) with the exception that the cells were incubated for 55 minutes with the DCFDA probe.
The presence of MDA, a marker of lipid peroxidation, was determined by assessing the thiobarbituric acid reactive substances in the medium (36, 37).
Reduced glutathione and acetaminophen-glutathione conjugates
The content of reduced glutathione (GSH) was determined after 4 h and 24 h of incubation with acetaminophen (APAP). The medium was removed and the cells were lysed in distilled water. Afterwards, 5% cold metaphosphoric acid was added and the samples were centrifuged (20,000 g, 4°C). The levels of GSH in the supernatant were measured using a modified fluorimetric method (38).
Sample preparation was identical for measurement of conjugate of APAP with glutathione (APAP-SG). The levels of APAP-SG were measured by mass spectrometry as described previously (39).
Caspase 3/7 activities
The activity of executioner caspases 3 and 7 was assessed at 4 h and 24 h after isolation using Caspase Glo 3/7 from Promega (Madison, WI, USA). After removing the media, the cells were exposed to Caspase Glo 3/7 reagent, which induced cell lysis and provided a substrate for caspases 3 and 7. The total luminescence was measured at time 0 min, 60 min and 120 min.
Protein isolation and Western blot analysis
The levels of antiapoptotic proteins Bcl-2 and Mcl-1 (11), phosphorylated 4E-BP1, an mTOR downstream target (12) and the 2E1 isoform of cytochrome P450, which is able to form a reactive APAP metabolite N-acetyl-p-benzoquinone imine (40, 41) were assessed by means of Western blot. After removing the media, the cells were lysed in Cell Lysis Buffer (Cell Signaling) supplemented with a cOmplete Mini protease inhibitor and a PhosSTOP phosphatase inhibitor (Roche Applied Science, Penzberg, Germany). The total protein content of lysates was assessed using the Bradford method. The samples were then adjusted to contain the same amount of protein (30 µg per lane) and subjected to SDS-PAGE using the gradient gels NuPAGE® Novex® Bis-Tris Mini 4 – 12% (Life Technologies). Afterwards, the proteins were transferred to a cellulose nitrate membrane (Bio-Rad Laboratories, Hercules, CA, USA) and exposed to the following antibodies: mouse Bcl-2 antibody, rabbit anti-Mcl-1, rabbit anti-CYP2E1, rabbit anti-phospho-4EBP1, all of which were obtained from Santa Cruz Biotechnology (Dallas, TX, USA). Mouse anti-β-actin was obtained from Sigma-Aldrich. Secondary goat anti-rabbit and goat anti-mouse IgG were obtained from Santa Cruz Biotechnology. Proteins were visualized using a chemiluminescence detection kit (Roche, Penzberg, Germany) and autoradiographic film (Foma, Hradec Kralove, Czech Republic). To confirm equal protein loading, each membrane was reprobed and reincubated to detect β-actin. Band density was evaluated using the Quantity One 4.6 software (Bio-Rad Laboratories, Hercules, CA, USA). The ratio of band densities of protein of interest and β-actin is referred to as relative density.
Statistical analysis
Hepatocytes were isolated repeatedly three times for ApoE4 and wild-type controls and twice for ApoE3. The results are expressed as means ± S.D.; n values are depicted in tables and figure legends. All statistical analyses were performed using GraphPad Prism 6.01 software (La Jolla, CA, USA). The numerical data were first tested for normality by means of a Kolmogorov-Smirnoff test. Data with Gaussian distribution were analyzed with ANOVA and Tukey’s post-test. Data with non-Gaussian distribution were analyzed by Kruskal-Wallis test and Dunn’s post-test. P < 0.05 was considered statistically significant.
RESULTS
Gene expression of Nrf2-dependent genes Nqo1, Hmox1, Gsta2
In the suspension of hepatocytes, there was a lower expression of Gsta2 and higher expression of Hmox1 in hepatocytes from ApoE4 mice when compared to wild-type hepatocytes (P < 0.05). A similar but non-significant trend was observed when comparing ApoE3 versus WT. There were no significant differences between the transgenic strains (not shown).
In hepatocytes cultured for 24 hours, the yield of RNA was sufficient only in cells treated with medium or 0.5 mmol/l APAP; we were not able to analyze the RNA from cells exposed to 1 mmol/l APAP and higher. The expression of Gsta2 and Nqo1 was lower in control ApoE4 hepatocytes when compared to control WT hepatocytes (P < 0.001). The expression of Gsta2 was also lower in control ApoE3 hepatocytes when compared to control WT hepatocytes (P < 0.05). All three genes displayed a higher expression in control ApoE3 hepatocytes when compared to control ApoE4 hepatocytes (P < 0.05 for Gsta2 and P < 0.01 for Nqo1 and Hmox1) (Fig. 1A).
 |
Fig. 1. Gene expression: quantitative real-time PCR comparing gene expression in ApoE3 versus ApoE4 hepatocytes after 24 h cultivation, box-and-whisker diagrams: (A) medium-treated, (B) treatment with 0.5 mmol/l APAP. |
In cells exposed to 0.5 mmol/l APAP, there was a lower expression of Gsta2 (P < 0.001) and Nqo1 (P < 0.05) when comparing ApoE4 and WT hepatocytes. The expression of Gsta2 was downregulated (P < 0.05) and Hmox1 upregulated (P < 0.01) when comparing ApoE3 and WT hepatocytes. Again, all three genes of interest were higher in ApoE3 when compared to ApoE4 hepatocytes (P < 0.01 for Gsta2 and Nqo1 and P < 0.001 for Hmox1) (Fig. 1B).
When comparing medium-treated cells with cells treated with 0.5 mmol/l APAP, there was an increase in Gsta2 and/or Hmox1 in all genotypes tested: increase in Gsta2 in WT hepatocytes (P < 0.05), Hmox1 in ApoE4 hepatocytes (P < 0.01), Gsta2 and Hmox1 in ApoE3 hepatocytes (P < 0.001) (not depicted).
Cell viability
As shown by the activity of extracellular lactate dehydrogenase, APAP led to a dose- and time-dependent toxicity. After 16 hours of exposure to 1 mM APAP, the apparent (twice or higher) increase in extracellular LDH activity was significant in all strains tested (P < 0.01 for ApoE4, P < 0.001 for WT and ApoE3) (Fig. 2A). After 20 h, the increase was most pronounced in ApoE3 hepatocytes. The damage after 24 h incubation identified by LDH leakage tended to be worst in hepatocytes from ApoE3 mice in concentrations of 0.75 mmol/l and 1 mmol/l APAP. When exposed to 4 mmol/l APAP, the LDH leakage reached 90% and was similar in all groups, suggesting necrosis in most of the cells (Fig. 2B).
In the WST-1 test, the activity of cellular dehydrogenases was significantly lower in hepatocytes treated with 4 mmol/l APAP for 24 h when compared to untreated controls (P < 0.001 in all genotypes). This decrease was more pronounced in both transgenic strains, most in ApoE3 mice (Fig. 2C).
† ,††, ††† versus control WT; ‡, ‡‡, ‡‡‡ versus control ApoE4; #, ##, ### versus control ApoE3, * versus corresponding WT; P < 0.05, P < 0.01, P < 0.001 respectively.
Incubation of hepatocytes of all genotypes with 1 mmol/l APAP led to signs of cellular damage visible in phase contrast microscopy: detachment of cells from collagen, spherical shape and plasma membrane blebbing, highly granular cytoplasm, loss of nuclear visibility. The loss of nuclear visibility was most pronounced in hepatocytes from ApoE3 mice. We also observed distinct intracellular vacuoli resembling lipid droplets in untreated controls of both transgenic strains (not shown).
Caspase activities
The activity of executioner caspases 3 and 7 did not differ among groups at the 4-hour interval (not shown). When exposed to 4 mmol/l APAP for 24 hours, there was a distinct decrease in all genotypes, most visible in ApoE3 (Fig. 2D). Similar results were obtained when recalculating the values to the relative luminiscence per µg of protein (not shown).
Oxidative stress
The levels of MDA in the culture medium did not differ among groups and were not significantly affected by APAP treatment. Only a non-significant trend to higher MDA production at 1 mmol/l and 4 mmol/l APAP was observed in all genotypes (Fig. 2E).
The ROS production displayed a non-significant increase at 2.5 mmol/l APAP in hepatocytes from WT mice and significant increases in both transgenic strains (P < 0.01 for ApoE4 and P < 0.001 for ApoE3) after 24 hour cultivation (Fig. 2F).
Lipid accumulation
The percentage of Oil Red O positive cells was higher in both untreated controls of ApoE4 and ApoE3 mice when compared to wild-type controls after 24 h cultivation (P < 0.05 for ApoE4 and P < 0.001 for ApoE3). The percentage of Oil Red O positive medium-treated cells did not differ significantly among transgenic mice (Fig. 3A-3D).
Mitochondrial membrane potential
After the 4 h incubation, there was a significant decrease in the percentage of cells with high mitochondrial membrane potential (MMP) in samples from ApoE3 mice exposed to 4 mmol/l APAP when compared to untreated controls and corresponding wild-type hepatocytes (P < 0.001 for both comparisons). The potential was higher in untreated cells from ApoE3 mice when compared to wild-type mice (P < 0.05) (Fig. 4G).
After 24 h, there was a significant (P < 0.01) decrease in MMP in cells exposed to the concentrations of APAP from 1 mmol/l in all genotypes tested (Fig. 4D-4F). The MMP was completely lost in hepatocytes from ApoE3 mice exposed to 1 mmol/l APAP for 24 hours while in hepatocytes from WT and ApoE4 mice after exposure to 2 mmol/l APAP. Concentrations of 0.5 mmol/l APAP did not affect the mitochondrial membrane potential in any group (Fig. 4H).
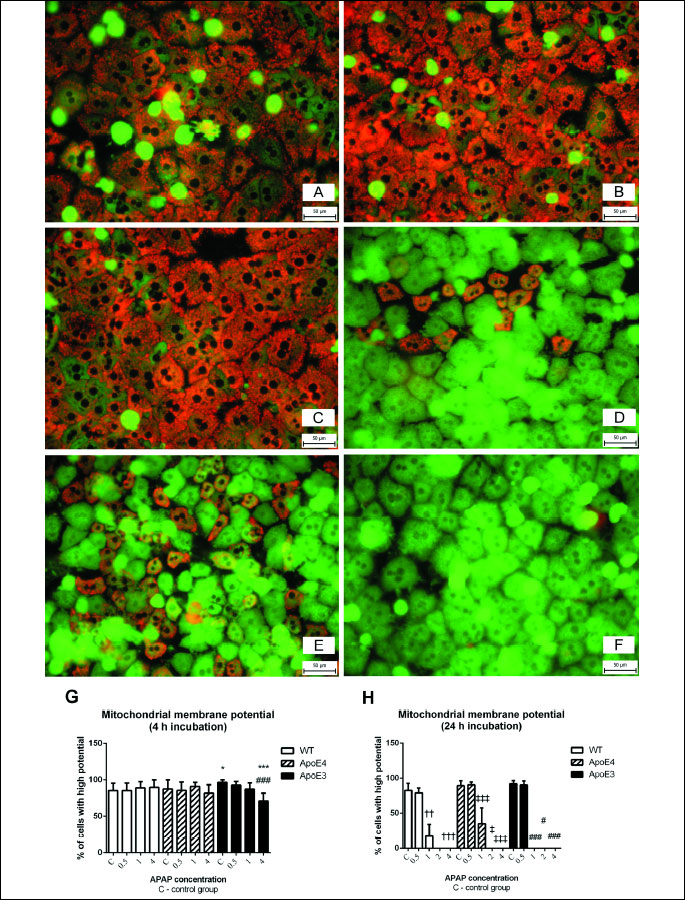
†, ††, ††† versus control WT; ‡, ‡‡, ‡‡‡ versus control ApoE4; #, ##, ### versus control ApoE3; *, **, *** versus corresponding WT; P < 0.05, P < 0.01, P < 0.001 respectively. JC-1 staining, objective magnification × 40, bar 50 µm.
Western blot analysis
The levels of antiapoptotic protein Bcl-2 were down-regulated in hepatocytes treated with 4 mmol/l APAP for 4 hours. This decline was more pronounced in WT and ApoE4 than in ApoE3 cells (Fig. 5B). We did not observe major differences in the expression of another antiapoptotic protein, Mcl-1 (Fig. 5A).
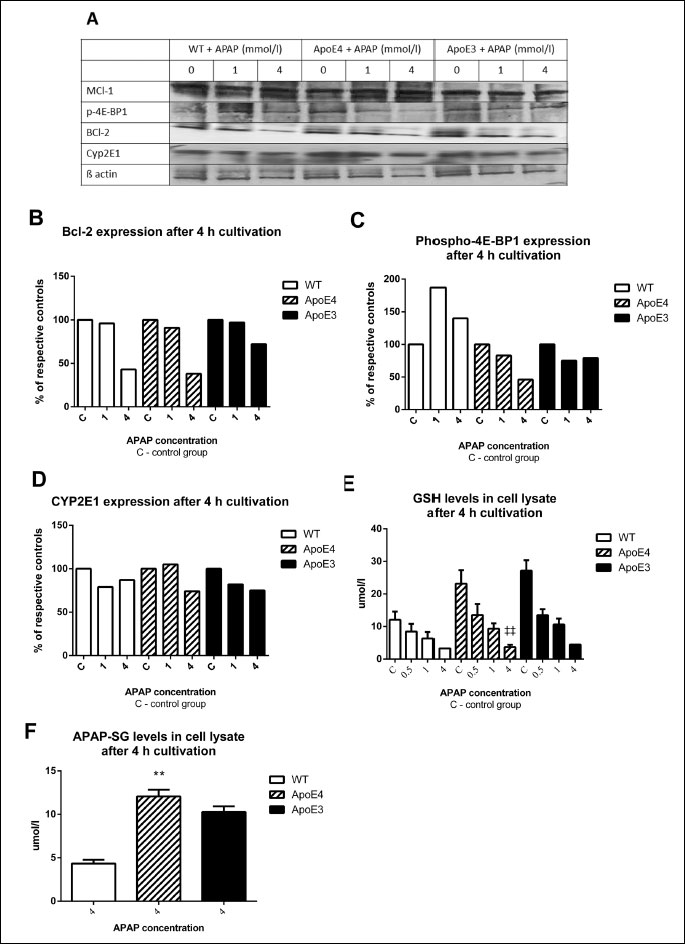
(C) phosphorylated 4E-BP1, (D) cytochrome P450 isoform 2E1. (E) levels of reduced glutathione, (F) levels of conjugate APAP-SG.
‡‡ versus control ApoE4, ** versus corresponding WT (P < 0.01).
The expression of phosphorylated 4E-BP1 displayed an increase after 4 hours of treatment with 1 and 4 mmol/l APAP in wild-type hepatocytes. In ApoE4 cells, there was a decline in phospho-4E-BP1, especially in cells exposed to 4 mmol/l APAP. Only a mild decrease after exposure to 1 and 4 mmol/l APAP was observed in ApoE3 cells (Fig. 5C).
The levels of the 2E1 isoform of cytochrome P450 showed a mild decrease when treated with 4 mmol/l APAP in both transgenic strains and negligible effect in WT hepatocytes (Fig. 5D).
Glutathione and acetaminophen-glutathione conjugates
A dose-dependent decline in GSH levels was observed in all APAP-exposed cells. At the highest dose of APAP (4 mmol/l), the GSH levels were below the detection limit in both transgenic strains. After 24 h treatment with 1 mmol/l APAP, the levels were lowest in hepatocytes from ApoE3 mice (non-significant difference between genotypes) (Fig. 5E).
The levels of APAP-SG after 4 hour cultivation were under the detection limit in cells exposed to concentrations of 1 mmol/l APAP and lower. At concentrations of 4 mmol/l APAP, the levels were higher in both transgenic strains when compared to wild-type controls (P < 0.01 for ApoE4, non-significant for ApoE3). There was no significant difference between the transgenic strains (Fig. 5F).
DISCUSSION
In the present study, APAP led to a dose-dependent hepatocyte toxicity in all genotypes tested. The toxicity was higher in both transgenic strains than in wild-type controls and most pronounced in ApoE3 mice. When exposed to 4 mmol/l APAP for 24 hours, nearly all cells displayed necrotic cell death.
We were able to reproduce the main findings of Graeser et al. (24), i.e. higher expression of Nrf2-dependent genes in cultivated hepatocytes from ApoE3 mice when compared to ApoE4 mice. The exposure to APAP led to the activation of some of the Nrf2-dependent genes in all genotypes tested, which is in accordance with other authors (11). However, the activation of Nrf2 is not always beneficial: a constitutive activation of Nrf2 led to a delay in liver regeneration after partial hepatectomy via changes in expression of cell-cycle and apoptosis regulating proteins (42).
Our findings of a decline in mitochondrial membrane potential after the treatment with APAP are in agreement with the findings of Xie et al. (13). This decline was most pronounced in hepatocytes from ApoE3 mice.
The activity of executioner caspases 3 and 7 was not increased upon APAP treatment, despite downregulation of the antiapoptotic protein Bcl-2. In light of other methods used, this is probably caused by a decrease in the total cell count due to necrosis. However, even when related to protein amount per sample, the activity was still lowest in hepatocytes treated for 24 hours with 4 mmol/l APAP. Our results are in accordance with Ni et al. (12), who reported cell death by necrosis only and in contrary to the findings of Mobasher et al. (11), who noticed activation of apoptosis. Inconsistency may be caused by different times and conditions of cultivation, doses of APAP and methods used for quantifying apoptosis.
The higher toxicity of APAP in both transgenic strains, when compared to wild-type controls, may be partly explained by lipid accumulation. In previous studies, hepatocytes and/or liver affected by NAFLD were more susceptible to APAP toxicity than lean ones (7, 40). This could be due to the induction of CYP2E1 activity by some lipid derivatives which then leads to high formation of reactive metabolite N-acetyl-p-benzoquinone imine (9). In addition, lipid accumulation per se seems to be a condition of increased oxidative stress (34). In the present study, we were not able to confirm the results of Graeser et al. (24), who reported higher hepatic triglycerides in ApoE4 than in ApoE3 mice.
CYP2E1 is able to induce upregulation of Nrf2 (43). The activation of Nrf2 by CYP2E1 seems to be dependent on oxidative stress caused by CYP2E1 activity (44). In the present study, the differences in protein expression of CYP2E1 were minimal between the transgenic strains. Thus, the differences of CYP2E1 expression cannot explain different activities of Nrf2 between the transgenic strains nor the differences in susceptibility to APAP-induced toxicity.
There was a rapid increase in ROS production at 2.5 mmol/l APAP after 24 hour cultivation in both transgenic strains but not in WT mice. Interestingly, the relative increase was highest in hepatocytes from ApoE3 mice. A decline in GSH levels was observed in all strains tested; this is in accordance with previous studies and the phenomenon of GSH consumption after APAP treatment (7, 11). After 24 hour exposure to APAP, this decline was most pronounced in the ApoE3 hepatocytes. These findings did not meet our expectations, since ApoE3 carriers have been reported to display higher antioxidant capacity than ApoE4 carriers (45). Furthermore, both transgenic strains displayed higher conjugation of APAP with glutathione than WT mice.
Consumption of GSH after APAP intake is not limited to the liver: Mast et al. described a significant decrease in muscle GSH content after 17-days of APAP intake in rats accompanied by signs of skeletal muscle wasting. Interestingly, these changes developed even without apparent hepatotoxicity (41).
Recently, a link between the Nrf2 pathway and autophagy was described (46). We observed lower levels of phosphorylated 4E-BP1, an mTOR downstream target, in both transgenic strains after treatment with 4 mmol/l APAP, pointing to activation of autophagy. This is in accordance with autophagy activation after APAP treatment (12). Considering the greater decline in ApoE4 than in ApoE3 hepatocytes, it may be suggested that the extent of autophagy can differ between the two transgenic strains.
Based on our study, there might be several causes leading to worse damage in hepatocytes from ApoE3 mice when compared to ApoE4 mice: a higher ROS production, higher GSH consumption, higher mitochondrial vulnerability, and possibly also different activation of autophagy after APAP treatment.
There were some limitations of our study: we tested only short-term toxicity in mice hepatocytes. It is not possible to extrapolate the long-term toxicity of low doses of APAP. Spheroids or other microengineered cultures of mouse hepatocytes would be optimal to assess chronic toxicity. Next, we did not assess the effect of APAP on other cell types of these transgenic mice. Other types of cell cultures or co-cultures could evaluate this aspect. In vivo studies would be advisable to confirm the findings of the present study in whole animals and clarify some of the mechanisms.
In conclusion, transgenic mice with ApoE4 and ApoE3 alleles displayed higher susceptibility to acute APAP toxicity in vitro than WT mice. Of the two transgenic genotypes tested, ApoE3 allele carriers were more prone to injury.
Acknowledgements: We would like to thank the Generi Biotech company for their help with qRT-PCR. Also thanks to Matthew Shane Renfro for language review. Our thanks go to Professor John J. Lemasters and Dr. Jiangting Hu for their advice regarding isolation of mouse hepatocytes.
Our work was supported by grants of Charles University in Prague PRVOUK P37/02 and SVV-2015-260179.
Conflict of interests: None declared.
REFERENCES
- Larson AM, Polson J, Fontana RJ, et al. Acetaminophen-induced acute liver failure: results of a United States multicenter, prospective study. Hepatology 2005; 42: 1364-1372.
- Dart RC, Bailey E. Does therapeutic use of acetaminophen cause acute liver failure? Pharmacotherapy 2007; 27: 1219-1230.
- Jaeschke H, Knight TR, Bajt ML. The role of oxidant stress and reactive nitrogen species in acetaminophen hepatotoxicity. Toxicol Lett 2003; 144: 279-288.
- Ramadori G, Moriconi F, Malik I, Dudas J. Physiology and pathophysiology of liver inflammation, damage and repair. J Physiol Pharmacol 2008; 59 (Suppl. 1): 107-117.
- Zimmerman HJ, Maddrey WC. Acetaminophen (paracetamol) hepatotoxicity with regular intake of alcohol: analysis of instances of therapeutic misadventure. Hepatology 1995; 22: 767-773.
- Tarantino G, Conca P, Basile V, et al. A prospective study of acute drug-induced liver injury in patients suffering from non-alcoholic fatty liver disease. Hepatol Res 2007; 37: 410-415.
- Kon K, Ikejima K, Okumura K, Arai K, Aoyama T, Watanabe S. Diabetic KK-A(y) mice are highly susceptible to oxidative hepatocellular damage induced by acetaminophen. Am J Physiol Gastrointest Liver Physiol 2010; 299: G329-G337.
- Kucera O, Rousar T, Stankova P, et al. Susceptibility of rat non-alcoholic fatty liver to the acute toxic effect of acetaminophen. J Gastroenterol Hepatol 2012; 27: 323-330.
- Michaut A, Moreau C, Robin MA, Fromenty B. Acetaminophen-induced liver injury in obesity and nonalcoholic fatty liver disease. Liver Int 2014; 34: e171-e179.
- Hohmann MS, Cardoso RD, Pinho-Ribeiro FA, et al. 5-Lipoxygenase deficiency reduces acetaminophen-induced hepatotoxicity and lethality. Biomed Res Int 2013; 2013: 627046. doi: 10.1155/2013/627046.
- Mobasher MA, Gonzalez-Rodriguez A, Santamaria B, et al. Protein tyrosine phosphatase 1B modulates GSK3beta/Nrf2 and IGFIR signaling pathways in acetaminophen-induced hepatotoxicity. Cell Death Dis 2013; 4: e626. doi: 10.1038/cddis.2013.150.
- Ni HM, Bockus A, Boggess N, Jaeschke H, Ding WX. Activation of autophagy protects against acetaminophen-induced hepatotoxicity. Hepatology 2012; 55: 222-232.
- Xie Y, McGill MR, Dorko K, et al. Mechanisms of acetaminophen-induced cell death in primary human hepatocytes. Toxicol Appl Pharmacol 2014; 279: 266-274.
- Ilic S, Drmic D, Zarkovic K, et al. High hepatotoxic dose of paracetamol produces generalized convulsions and brain damage in rats. A counteraction with the stable gastric pentadecapeptide BPC 157 (PL 14736). J Physiol Pharmacol 2010; 61: 241-250.
- Liu J, Wu KC, Lu YF, Ekuase E, Klaassen CD. Nrf2 protection against liver injury produced by various hepatotoxicants. Oxid Med Cell Longev 2013; 2013: 305861. doi: 10.1155/2013/305861.
- Surh YJ, Kundu JK, Na HK. Nrf2 as a master redox switch in turning on the cellular signaling involved in the induction of cytoprotective genes by some chemopreventive phytochemicals. Planta Med 2008; 74: 1526-1539.
- Chen C, Kong AN. Dietary chemopreventive compounds and ARE/EpRE signaling. Free Radic Biol Med 2004; 36: 1505-1516.
- Enomoto A, Itoh K, Nagayoshi E, et al. High sensitivity of Nrf2 knockout mice to acetaminophen hepatotoxicity associated with decreased expression of ARE-regulated drug metabolizing enzymes and antioxidant genes. Toxicol Sci 2001; 59: 169-177.
- Reisman SA, Csanaky IL, Aleksunes LM, Klaassen CD. Altered disposition of acetaminophen in Nrf2-null and Keap1-knockdown mice. Toxicol Sci 2009; 109: 31-40.
- Ni HM, Boggess N, McGill MR, et al. Liver-specific loss of Atg5 causes persistent activation of Nrf2 and protects against acetaminophen-induced liver injury. Toxicol Sci 2012; 127: 438-450.
- Reisman SA, Buckley DB, Tanaka Y, Klaassen CD. CDDO-Im protects from acetaminophen hepatotoxicity through induction of Nrf2-dependent genes. Toxicol Appl Pharmacol 2009; 236: 109-114.
- Xu W, Hellerbrand C, Kohler UA, et al. The Nrf2 transcription factor protects from toxin-induced liver injury and fibrosis. Lab Invest 2008; 88: 1068-1078.
- Kang HJ, Hong YB, Kim HJ, Wang A, Bae I. Bioactive food components prevent carcinogenic stress via Nrf2 activation in BRCA1 deficient breast epithelial cells. Toxicol Lett 2012; 209: 154-160.
- Graeser AC, Boesch-Saadatmandi C, Lippmann J, et al. Nrf2-dependent gene expression is affected by the proatherogenic apoE4 genotype-studies in targeted gene replacement mice. J Mol Med (Berl) 2011; 89: 1027-1035.
- Stachowska E, Maciejewska D, Ossowski P, et al. Apolipoprotein E4 allele is associated with substantial changes in the plasma lipids and hyaluronic acid content in patients with nonalcoholic fatty liver disease. J Physiol Pharmacol 2013; 64: 711-717.
- Kus K, Wisniewska A, Toton-Zuranska J, Olszanecki R, Jawien J, Korbut R. Significant deterioration of anti-atherogenic efficacy of nebivolol in a double (apolipoprotein E and endothelial nitric oxide synthase) knockout mouse model of atherosclerosis in comparison to single (apolipoprotein E) knockout model. J Physiol Pharmacol 2014; 65: 877-881.
- Heeren J, Beisiegel U, Grewal T. Apolipoprotein E recycling: implications for dyslipidemia and atherosclerosis. Arterioscler Thromb Vasc Biol 2006; 26: 442-448.
- Corpechot C, Benlian P, Barbu V, Chazouilleres O, Poupon RE, Poupon R. Apolipoprotein E polymorphism, a marker of disease severity in primary biliary cirrhosis? J Hepatol 2001; 35: 324-328.
- Demirag MD, Onen HI, Karaoguz MY, et al. Apolipoprotein E gene polymorphism in nonalcoholic fatty liver disease. Dig Dis Sci 2007; 52: 3399-3403.
- De Feo E, Cefalo C, Arzani D, et al. A case-control study on the effects of the apolipoprotein e genotypes in nonalcoholic fatty liver disease. Mol Biol Rep 2012; 39: 7381-7388.
- Merrick BA, Bruno ME, Madenspacher JH, et al. Alterations in the rat serum proteome during liver injury from acetaminophen exposure. J Pharmacol Exp Ther 2006; 318: 792-802.
- Bajt ML, Knight TR, Lemasters JJ, Jaeschke H. Acetaminophen-induced oxidant stress and cell injury in cultured mouse hepatocytes: protection by N-acetyl cysteine. Toxicol Sci 2004; 80: 343-349.
- Pfaffl MW, Horgan GW, Dempfle L. Relative expression software tool (REST) for group-wise comparison and statistical analysis of relative expression results in real-time PCR. Nucleic Acids Res 2002; 30: e36.
- Kucera O, Endlicher R, Rousar T, et al. The effect of tert-butyl hydroperoxide-induced oxidative stress on lean and steatotic rat hepatocytes in vitro. Oxid Med Cell Longev 2014; 2014: 1-12.
- Stankova P, Kucera O, Lotkova H, Rousar T, Endlicher R, Cervinkova Z. The toxic effect of thioacetamide on rat liver in vitro. Toxicol in vitro 2010; 24: 2097-2103.
- Ohkawa H, Ohishi N, Yagi K. Assay for lipid peroxides in animal tissues by thiobarbituric acid reaction. Anal Biochem 1979; 95(2): 351-358.
- Cervinkova Z, Krivakova P, Labajova A, et al. Mechanisms participating in oxidative damage of isolated rat hepatocytes. Arch Toxicol 2009; 83: 363-372.
- Rousar T, Kucera O, Lotkova H, Cervinkova Z. Assessment of reduced glutathione: comparison of an optimized fluorometric assay with enzymatic recycling method. Anal Biochem 2012; 423: 236-240.
- Rousar T, Nydlova E, Cesla P, et al. Purified acetaminophen-glutathione conjugate is able to induce oxidative stress in rat liver mitochondria. Physiol Res 2012; 61 (Suppl. 2): S103-S109.
- Donthamsetty S, Bhave VS, Mitra MS, Latendresse JR, Mehendale HM. Nonalcoholic steatohepatitic (NASH) mice are protected from higher hepatotoxicity of acetaminophen upon induction of PPARalpha with clofibrate. Toxicol Appl Pharmacol 2008; 230: 327-337.
- Mast C, Joly C, Savary-Auzeloux I, Remond D, Dardevet D, Papet I. Skeletal muscle wasting occurs in adult rats under chronic treatment with paracetamol when glutathione-dependent detoxification is highly activated. J Physiol Pharmacol 2014; 65: 623-631.
- Kohler UA, Kurinna S, Schwitter D, et al. Activated Nrf2 impairs liver regeneration in mice by activation of genes involved in cell-cycle control and apoptosis. Hepatology 2014; 60: 670-678.
- Kathirvel E, Chen P, Morgan K, French SW, Morgan TR. Oxidative stress and regulation of anti-oxidant enzymes in cytochrome P4502E1 transgenic mouse model of non-alcoholic fatty liver. J Gastroenterol Hepatol 2010; 25: 1136-1143.
- Lu Y, Zhang XH, Cederbaum AI. Ethanol induction of CYP2A5: role of CYP2E1-ROS-Nrf2 pathway. Toxicol Sci 2012; 128: 427-438.
- Jofre-Monseny L, Minihane AM, Rimbach G. Impact of apoE genotype on oxidative stress, inflammation and disease risk. Mol Nutr Food Res 2008; 52: 131-145.
- Ni HM, Woolbright BL, Williams J, et al. Nrf2 promotes the development of fibrosis and tumorigenesis in mice with defective hepatic autophagy. J Hepatol 2014; 61: 617-625.
A c c e p t e d : December 7, 2015